Pages Menu

Posted on Jan 30, 2015 in Original Article | 4 comments

Google Glass Indirect Ophthalmoscopy

Aaron Wang, MD, PhD1, Alex Christoff, CO, COT1, David L. Guyton, MD1, Michael X. Repka, MD1, Mahsa Rezaei, MS1, Allen O. Eghrari, MD1

1Department of Ophthalmology, Johns Hopkins University School of Medicine, Baltimore, Maryland, USA

Corresponding Author: allen@jhmi.edu

Journal MTM 4:1:15–19, 2015

doi:10.7309/jmtm.4.1.4


Background: Google Glass is a wearable, head-mounted computer with display, photographic and videographic imaging capability, and connectivity to other devices through Wi-Fi and Bluetooth signaling.

Aims: To describe for the first time the use of Google Glass for use in indirect ophthalmoscopy and modification techniques to assist with its use.

Methods: A lightweight, portable light source was installed above the Glass aperture, a small tissue paper used to diffuse the light, and the arm of the headset was taped to the examiner’s glasses in order to bring the display into the right eye’s central visual field.

Results: Using a slightly modified Glass headset, the examiner documented the central and peripheral retina in a young male with ease.

Conclusion: We demonstrate for the first time that Glass, with minor modifications, can be used as a simple and effective method to perform and record a fundus examination.


Read More

Posted on Jan 30, 2015 in Original Article | 0 comments

Health Care Apps- will they be a Facelift for Today’s Medical/Dental Practice?

Deepika Jasti1, KVNR Pratap, MDS2, Madhavi Padma.T, MDS3, V. Siva Kalyan, MDS4, M. Pavana Sandhya, MDS5, ASK. Bhargava, MDS6

1Final year Post graduate student, Department Of Public Health Dentistry, Mamata Dental College, Khammam-507002, Andhra Pradesh, India; 2Professor and Head, Department Of Public Health Dentistry, Mamata Dental College, Khammam-507002, Andhra Pradesh, India; 3Professor, Department Of Public Health Dentistry, Mamata Dental College, Khammam-507002, Andhra Pradesh, India; 4Reader, Department Of Public Health Dentistry, Mamata Dental College, Khammam- 507002, Andhra Pradesh, India; 5Senior Lecturer, Department Of Public Health Dentistry, St. Joseph Dental College, Eluru-534003, Andhra Pradesh, India; 6Senior Lecturer, Department Of Public Health Dentistry, Mamata Dental College, Khammam-507002, Andhra Pradesh, India

Corresponding Author: deepikajastii@gmail.com

Journal MTM 4:1:8–14, 2015

doi:10.7309/jmtm.4.1.3


Background: With the recent advent of smart phones, usage of medical apps is on rise. Smart phones are powerful devices that combine the conventional functions of a mobile phone with advanced computing capabilities enabling users to access software applications commonly termed as “apps”. Health care applications (apps) that are downloadable on to smart phones are increasingly becoming popular among clinicians.

Aim: The aim of the present study was to assess the usage of health care apps among Medical and Dental doctors.

Methodology: A descriptive cross sectional questionnaire based study was conducted on medical and dental doctors of Mamata hospitals, Khammam, Andhra Pradesh. A pretested, self administered questionnaire was used and it consists of questions regarding demographic data followed by usage of health care apps. Descriptive statistics were computed to demonstrate the frequency of responses and the comparisons were made using chi-square test. A p-value less than or equal to 0.05 was considered to be significant.

Results: A total of eighty doctors (48 Medical and 32 dental) completed the questionnaire. More males (n = 63) than females (n = 17) participated in the study. Participants had a mean age of 32.5 years. It was found that 68% of dental doctors and 70.45% of medical doctors are using health care apps on their smart phone. Most of the participants (58.8% of dental and 77.4% medical doctors) use the health care apps for knowledge purposes, while no dental doctors used the apps for diagnosis or treatment purposes. The majority of the dental doctors (41.17%) are using these apps for patient education purpose when compared to the medical doctors (3.22%).

Conclusion: There is a high usage rate of health care apps among both medical and dental doctors, with medical doctors using the apps for informational purposes, whereas dental doctors used the apps for patient education.


Read More

Posted on Jan 30, 2015 in Original Article | 0 comments

Accuracy of Estimates of Step Frequency From a Wearable Gait Monitor

M Punt, MSc1, H Wittink, PhD1, F van der Bent, Ing1, Jh van Dieën, PhD2,3

1Research group Lifestyle and Health, Utrecht University of Applied Sciences, Utrecht, The Netherlands; 2Move Research Institute Amsterdam, Faculty of Human Movement Sciences, VU University Amsterdam, Amsterdam, the Netherlands; 3King Abdulaziz University, Jeddah, Saudi Arabia

Corresponding Author: Michiel.punt@hu.nl

Journal MTM 4:1:2–7, 2015

doi:10.7309/jmtm.4.1.2


Background: Assessment of gait activity by accelerometry requires data analysis. Currently several methods are used to estimate step frequency. At present the relation between step frequency estimation, gait speed and minimal required time window length remains unknown.

Aims: The purpose of the study was to assess the accuracy of estimates of step frequency (SF) from trunk acceleration data analyzed with commonly used algorithms and time window lengths, at a wide range of gait speeds.

Method: Twenty healthy young subjects performed an incremental treadmill protocol from 1 km/h up to 6 km/h, with steps of 1 km/h. Each speed condition was maintained for two minutes. A waist worn accelerometer recorded trunk accelerations, while video analysis provided the correct number of steps taken during each gait speed condition. Accuracy of two commonly used signal analysis methods (autocorrelation, fast Fourier transformation) was examined with time windows of two, four and eight seconds.

Results: Our main finding was that accuracy of SF estimates with fast Fourier transformation and autocorrelation improved with increasing time window size, only at the lower gait speeds. Accuracy of SF estimation was lower at low gait speeds independent of the algorithm and time window used.

Conclusion: We recommend a minimum TW length of 4 seconds when using AC and PSD algorithms and when using the PSD algorithm to use spectral averaging, as this leads to better results at short TW and low gait speeds.


Read More

Posted on Jul 28, 2014 in Original Article | 2 comments

Epilepsy Treatment Simplified through Mobile Ketogenic Diet Planning

Hanzhou Li1,3, Jeffrey L. Jauregui, PhD4, Cagla Fenton RD, LDN1,2, Claire M. Chee RD, BS1, A.G. Christina Bergqvist M.D1,5

1Division of Neurology, Department of Pediatrics; 2Department of Clinical Nutrition, The Children’s Hospital of Philadelphia, Philadelphia, PA 19104; 3Department of Biology University of Pennsylvania, Philadelphia, PA 19104; 4Department of Mathematics, Union College, Schenectady, NY 12308; 5The Perelman School of Medicine, University of Pennsylvania, Philadelphia, PA 19104

Corresponding Author: lih3@email.chop.edu

Journal MTM 3:2:11–15, 2014

doi:10.7309/jmtm.3.2.3


Background: The Ketogenic Diet (KD) is an effective, alternative treatment for refractory epilepsy. This high fat, low protein and carbohydrate diet mimics the metabolic and hormonal changes that are associated with fasting.

Aims: To maximize the effectiveness of the KD, each meal is precisely planned, calculated, and weighed to within 0.1 gram for the average three-year duration of treatment. Managing the KD is time-consuming and may deter caretakers and patients from pursuing or continuing this treatment. Thus, we investigated methods of planning KD faster and making the process more portable through mobile applications.

Methods: Nutritional data was gathered from the United States Department of Agriculture (USDA) Nutrient Database. User selected foods are converted into linear equations with n variables and three constraints: prescribed fat content, prescribed protein content, and prescribed carbohydrate content. Techniques are applied to derive the solutions to the underdetermined system depending on the number of foods chosen.

Results: The method was implemented on an iOS device and tested with varieties of foods and different number of foods selected. With each case, the application’s constructed meal plan was within 95% precision of the KD requirements.

Conclusion: In this study, we attempt to reduce the time needed to calculate a meal by automating the computation of the KD via a linear algebra model. We improve upon previous KD calculators by offering optimal suggestions and incorporating the USDA database. We believe this mobile application will help make the KD and other dietary treatment preparations less time consuming and more convenient.


Introduction

Treatment-resistant epilepsy is a national health problem that affects up to 40% of patients with epilepsy and results in significant morbidity, reduced quality of life, and cost to society13. For these patients, the Ketogenic Diet (KD), a high fat, low protein and carbohydrate diet, remains an effective therapy4. More than half achieve significant seizure reduction and up to 20% become seizure-free58. Use of the KD also allows for reduction in medications and antiepileptic drug-related side effects9. As a result, the use of the KD is increasing across the world10.

Management of KD in children is time-consuming for both the families that have to prepare the meals and the registered dietician (RD) who supervises the diet. In order to maximize success of the KD, caretakers of the patient must follow the prescribed fat, protein, carbohydrate, and caloric intake-per-day guidelines set by their KD team7. During the average three-year duration of treatment, these requirements adjust as the child grows. Each meal is precisely weighed to within 0.1 of a gram11. To maintain the 4:1 (in grams, fat: carbohydrates plus protein) ratio, exact proportions are either computed by hand or with the assistance of one of the currently available Internet KD calculator or homemade parent calculators12,13. This requires an organized caretaker, the ability to perform some algebra, and/or large time commitment by the RD in creating menus or in checking the accuracy of menus created on these Internet KD calculators. This can be a direct deterrent for a family to try the KD, physicians from referring patients to a KD program, or result in discontinuation of the treatment despite positive results14.

We created an automatic KD planning application that is based on a linear algebra model. The mobile application has the ability to not only perform the calculations, but also to offer the exact, optimal amount of each food in order to maintain the prescribed recommendations set by the dietician. By incorporating the United States Department of Agriculture (USDA) nutrient database, the application offers the caretakers a large selection of food choices instead of relying on a small set of approved recipes. This mobile application eliminates the burden of hand computation, offers the flexibility of food choices, and guarantees the maintenance of the exact recommendation by the dietician. The application is currently offered to our patients in order to receive further feedback in terms of user interface, design, and other improvements. The application will be offered openly to the general public on the Apple App Store in the subsequent months when the refinements are incorporated.

Methods

In this study, we investigate an algorithm to compute the quantities of food to be prepared for any ratio KD meal. We assume the user has selected n foods, and our goal is to compute the amount each of food, in grams, needed to fulfill the KD plan. These weights (in grams) are denoted by the unknown variables x1, x2, …, xn. For each i=1, 2, …, n, we consult the USDA Nutrient Database to ascertain numbers ai, bi, and ci, which denote the fat per gram, protein per gram, and carbohydrate per gram, respectively, of the ith food. Finally, we let d1, d2, and d3 denote the prescribed fat, protein, and carbohydrate content required, which are determined by the size of the meal and the parameters of the diet. Equating the total amounts of fat, protein, and carbohydrates determined by the food choices to equal those prescribed by the diet, we arrive at the following system of linear equations:

which can alternatively be written in matrix form as:

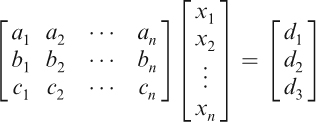
We denote by A the coefficient matrix, x the vector of unknowns, and b the vector consisting of d1, d2, and d3; thus, the system can be written simply as Ax=b. We apply the following methodology (Figure 1), based on the number of distinct food choices, to determine a solution or approximate solution x to the above system. To reiterate, the entries of the vector x are the respective amounts of the n foods to be given to the patient.

Figure 1: Algorithm For Solving Equations Depending on the Number of Foods Chosen

Less than three distinct food choices

If the number of foods selected is less than three, the system of equations is overdetermined (i.e., there are more constraints than variables). Thus, a solution will generally not exist, so we use the least-squares method to determine an approximate solution x by the formula:

where AT is the matrix transpose of A. In practice, ATA has full rank and so its inverse exists. If an entry of x is negative, the user is warned that no feasible solution was found, so more food choices must be selected.

Three distinct food choices

If three foods are selected, the matrix A is 3-by-3. Moreover, since the food choices are distinct, A has full rank in practice and is therefore invertible. In particular, there exists a unique solution x, given by the equation:

Again, if an entry of x is negative, the user is warned and prompted to select more food choices.

More than three distinct food choices

If the number of foods selected exceeds three, the system of equations is underdetermined. Generally, this means there are infinitely many combinations of the selected foods that would yield a KD appropriate meal. To determine a well-defined, positive solution, we use the Ordered Subsets Expectation Maximization (OSEM) method15.

We briefly explain the details of our OSEM implementation. We begin with a vector xj(0), where j=1, 2, …, n consists of all 1’s. The vector xj(k) will denote the vector at the kth iteration. At each iteration step, we compute

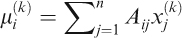
where i=1,2,3, followed by the iteration step

We halt the iteration when the difference between xj(k)> and xj(k+1) is sufficiently small, and use xj(k+1) as our solution. By construction, all of its entries are nonnegative and correspond to the suggested amount of each food.

Results

The methods were implemented in an iOS application and the results are depicted in Figure 2. The diet plan used consisted of a 4:1 ratio KD with 70mg of heavy cream. Because the heavy cream amount is static, the nutritional values are simply subtracted from the total. Figure 2 A demonstrates the application processing two food choices: tofu and sesame oil. Figure 2 B demonstrates the application processing three food choices: chicken tenders, hard-boiled egg, and olive oil. Figure 2 C demonstrates the application processing four food choices: mozzarella cheese, tomatoes, basil, and olive oil. From each of the figures, the total nutrition of the meal matches closely with the recommended KD values. The green progress bar indicates that the application’s constructed meal plan is within 95% precision of the KD requirements. These results demonstrate the robustness of the methods in generating an appropriate, precise meal plan given a variety of input food choices.

Figure 2: Example Calculations Using the Mobile Application

Discussion

The KD is rewarding but managing it is very time-consuming. Most KD RDs have therefore moved from hand computation and pre-calculated meal plans to using homemade excel spreadsheets or the programs available on the Internet such as the KetoCalculator or the Stanford Keto Calculator12,13. Many RDs also allow direct caretaker access to these programs but require meal plan reviews. Other KD programs adopted an exchange system that simplifies calculations at the expense of nutritional precision16.

Current applications such as the KetoCalculator and other KD Excel spreadsheets prompt the user to attempt to match the KD requirements. With these programs the user increments the amount of each food until the total nutrition matches the prescribed amounts. This takes time and might not achieve the accuracy demanded by the KD. In comparison, our mobile application can algorithmically calculate suggested values for each food item. It instantaneously suggests the exact amounts.

Additionally, currently available calculators only control for the ratio, and not for the macronutrients. For example, they allow the user to maintain a 4:1 KD meal by replacing the protein with carbohydrates by adjusting accordingly to the expression (fat) / (protein + carbohydrate). This potentially can result in insufficient protein intake, which over time can cause protein deficiency and poor growth as we have seen with referred patients from other centers seeking second opinions. Our application’s algorithm does not allow for any deviation from the prescribed amounts of the macronutrients, and will function for any ratio higher or lower than the standard 4:1. Finally, this application utilizes the USDA database as the source for nutritional information and therefore guarantees accuracy and a large selection of food choices. With this program, the meal planning process only takes a few food selections and the click of a button. The flexibility and convenience of a mobile application truly makes the KD much more manageable.

Conclusions

The Ketogenic Diet has great potential in treating refractory epilepsy but requires a heavy demand on the KD staff and caretakers of the patients. To make the KD more manageable, we developed and implemented a mobile application to simplify the KD. We also demonstrated that the methodology generates a medically acceptable meal plan as long as there exists a solution given the food choices. By utilizing mobile technology, we are able to provide effective medical guidance at the users’ convenience. We intend to gather further data from patients regarding how they determine preferences between the foods they choose. Then, we would create additional optimizing constraints to improve the algorithm. Finally, we hope this study will make the KD and other dietary treatments a practical possibility for more caretakers.

Acknowledgements

We thank the Children’s Hospital of Philadelphia Ketogenic Diet program for supporting this work. The Ketogenic diet patients inspired us to create this program, which we hope will assist them in their daily management of the Ketogenic diet. The first author would like to thank Dr. Joshua Plotkin for encouraging him to pursue this interest.

References

1. Begley CE, Famulari M, Annegers JF, Lairson DR, Reynolds TF, Coan S, et al. The cost of epilepsy in the United States: an estimate from population-based clinical and survey data. Epilepsia. 2000 Mar;41(3):342–51.

2. Kotsopoulos IA, Evers SM, Ament AJ, de Krom MC. Estimating the costs of epilepsy: an international comparison of epilepsy cost studies. Epilepsia. 2001 May;42(5):634–40.

3. Park C, Wethe JV, Kerrigan JF. Decreased quality of life in children with hypothalamic hamartoma and treatment-resistant epilepsy. J Child Neurol. 2013 Jan;28(1):50–5.

4. Bergqvist AG, Schall JI, Gallagher PR, Cnaan A, Stallings VA. Fasting versus gradual initiation of the ketogenic diet: a prospective, randomized clinical trial of efficacy. Epilepsia. 2005 Nov;46(11):1810–9.

5. Henderson CB, Filloux FM, Alder SC, Lyon JL, Caplin DA. Efficacy of the ketogenic diet as a treatment option for epilepsy: meta-analysis. J Child Neurol. 2006 Mar;21(3):193–8.

6. Lefevre F, Aronson N. Ketogenic diet for the treatment of refractory epilepsy in children: A systematic review of efficacy. Pediatrics. 2000 Apr;105(4):E46.

7. Neal EG, Chaffe H, Schwartz RH, Lawson MS, Edwards N, Fitzsimmons G, et al. The ketogenic diet for the treatment of childhood epilepsy: a randomised controlled trial. Lancet Neurol. 2008 Jun;7(6):500–6.

8. Levy RG, Cooper PN, Giri P. Ketogenic diet and other dietary treatments for epilepsy. Cochrane Db Syst Rev. 2012(3).

9. Nam SH, Lee BL, Lee CG, Yu HJ, Joo EY, Lee J, et al. The role of ketogenic diet in the treatment of refractory status epilepticus. Epilepsia. 2011 Nov;52(11):e181–4.

10. Kossoff EH, McGrogan JR. Worldwide use of the ketogenic diet. Epilepsia. 2005 Feb;46(2):280–9.

11. Mike EM. Practical guide and dietary management of children with seizures using the ketogenic diet. Am J Clin Nutr. 1965 Dec;17(6):399–409.

12. Zupec-Kania B. KetoCalculator: a web-based calculator for the ketogenic diet. Epilepsia. 2008 Nov;49 Suppl 8:14–6.

13. Stanford Medical Center – Ketogenic Diet Program. Stanford University; Available from: http://www. stanford.edu/group/ketodiet.

14. Lightstone L, Shinnar S, Callahan CM, O’Dell C, Moshe SL, Ballaban-Gil KR. Reasons for failure of the ketogenic diet. J Neurosci Nurs. 2001 Dec;33(6):292–5.

15. Hudson HM, Larkin RS. Accelerated image reconstruction using ordered subsets of projection data. IEEE Trans Med Imaging. 1994;13(4):601–9.

16. Carroll J, Koenigsberger D. The ketogenic diet: a practical guide for caregivers. J Am Diet Assoc. 1998 Mar;98(3):316–21.

Read More

Posted on Jul 27, 2014 in Original Article | 0 comments

Validation of a Portable Electronic Visual Acuity System

Pavindran A Gounder, MBBS1, Eliza Cole, MBBS2, Stephen Colley, MBBS, FRANZCO3,
David M Hille, Msc(Oxon)4

1Fremantle Hospital; 2Fremantle Hospital; 3Fremantle Hospital; 4Medical Student, University of Western Australia, WA, Australia

Corresponding author: pav.gounder@gmail.com

Journal MTM 3:2:35–39, 2014

doi:10.7309/jmtm.3.2.6


Background: The use of tablet devices and smartphones in medicine as assessment tools is becoming more widespread. These devices now run mobile applications or “apps” that have traditionally been the domain of desktop computers or more dedicated hardware. It is important that health professionals have confidence in the accuracy of measurements obtained from these new tools. The “EyeSnellen” app for the iPhone/iPad (running Apple Inc’s iOS operating system) allows users to measure visual acuity using a portable Snellen chart installed on a tablet device.

Aims: To compare the visual acuity measurements obtained from EyeSnellen iPad app with a standard illuminated Snellen Chart.

Methods: Participants were recruited from a tertiary level eye clinic in Western Australia. Visual acuity was measured using the Snellen light box chart and a visual acuity measurement was obtained using EyeSnellen app installed on an Apple iPad mini with the use of an Apple Iphone as a remote that was connected via Bluetooth.

Results: 122 eyes were tested. Bland-Altman analysis revealed a mean difference of 0.001 logMAR units between the visual acuity measurements obtained from EyeSnellen app and those taken on the light box chart with 95% limits of agreement of –0.169 to 0.171.

Conclusion: The Snellen Chart function on EyeSnellen app is equivalent to the traditional Snellen chart at measuring visual acuity at a test distance of 6 metres.


Introduction

Measurement of visual acuity provides a screening tool for the diagnosis of underlying disease and can be used as a predictor of the functional consequences of visual loss1. It is the first of the “vital signs” of ophthalmology. The original Snellen chart was developed in 1862 by Dr Herman Snellen and since that time many variations have been proposed and considered.

Since the advent of Smartphones and tablet devices, ‘apps’ have been used to simplify many existing daily tasks. In medicine there are an increasing number of uses for these devices and apps are now used widely as resources for learning and tools for improving clinical assessment and treatment. Currently there are multiple apps available worldwide for testing visual acuity however few have been standardised and validated for use.

The EyeSnellen app was developed by Dr Stephen Colley (www.eyeapps.com.au), a Western Australian Ophthalmologist, and released on the iTunes App store in December 20122. It uses an iPad to display the Snellen chart and an iPhone or iPod as a remote device via Bluetooth. There have been regular updates with new features and the app is currently version 1.6 (as of December 2013). There have been over 9500 downloads as of March 2014.

To date, there have been two published studies comparing visual acuity estimates using a standard eye chart and an eye chart on an iPad/tablet device. The first, a study conducted in a Chinese ophthalmic centre, compared an iOS app (Eye Chart Pro) against a tumbling E light box chart3. Their study collected measurements from 240 eyes and concluded that the Eye Chart Pro app was reliable for visual acuity testing when the Snellen visual acuity was better than a decimal visual acuity of 0.1. The second study, conducted in New Zealand, collected visual acuity measurements on patients without ocular pathology4. The study concluded that tablet computer devices were only suitable for use in situations where sources of glare could be eliminated. There has not been a study validating the use of a Snellen chart on a tablet device.

The portability of tablet devices also makes them ideal for remote and rural health care settings and for mobile screening units.

We hypothesized that the EyeSnellen iPad tool was comparable to the traditional Snellen chart at measuring visual acuity at a test distance of 6 metres.

Methods

The study was approved by the South Metropolitan Health Service Human Research Ethics Committee. All participants provided informed consent before participating in the study.

Participants were recruited from presentations to the Fremantle Hospital Eye Clinic over a period of two weeks. Patients were excluded from participating if they were below the age of 16, English was their second language or if their visual acuity was worse than measureable on the Snellen Chart.

Visual acuity was assessed using the Snellen Chart function on the EyeSnellen iOS app (ver 1.6) installed on a second generation Apple iPad mini and using a traditional Snellen light box chart. The Snellen Chart function was chosen as it is the most commonly used chart for testing acuity of vision in Western Australian ophthalmology clinics.

EyeSnellen was installed on a first generation iPad mini (163 pixels pwer inch, 160 mm × 120 mm screen seize) and an Apple iPhone 5S was used as a wireless remote control for the use of the chart on the Apple iPad mini. The brightness was set to 75% using an in app control which gave an illumination of 200 lux when measured with a light meter. Visual acuity intervals provided by EyeSnellen app were 6/60, 6/36, 6/24, 6/18, 6/12, 6/9, 6/7.5, 6/6 and 6/4.5. The iPad mini was mounted with Velcro onto a light box chart using a Belkin Shield Sheer Matte Case. (Figure 1, Figure 2)

Figure 1: EyeSnellen iOS application displayed on an iPad mini that was mounted to a traditional lightbox with the use of Velcro and a case

Figure 2: Screenshot from Apple iPhone 5S with EyeSnellen remote installed

The retro illuminated Snellen box chart provided an illumination of 600 lux. The measureable visual acuity intervals provided by the box chart were 6/60, 6/36, 6/24, 6/18, 6/12, 6/9, 6/6, 6/5 and 6/4. (Figure 3)

Figure 3: Snellen Light Box Chart

Visual acuity measurements were assessed and recorded by two resident medical officers.

Patients were instructed to stand 6 metres from both charts. A spectacle vision occluder was used to first test the right then left eye of patients. Patients were instructed to read each line until they were no longer able to resolve the optotype. A visual acuity measurement was recorded if the patient was able to read more than half the optotypes of a given line. Visual acuity was first assessed using EyeSnellen app and followed by a measurement using the traditional Snellen Chart. Neither the assessors nor the patients were masked for the outcome of the vision test. The same refractive correction was maintained for measurements with both charts (either unaided, habitual correction or pinholes).

Visual acuity measurements were recorded as decimals. Results were then converted to logMAR visual acuity for statistical analysis. R (Ver 3.0.2), a freely available statistical computer package5, was used to calculate the results.

Results

A total of 67 participants (average age 57, range 19–89) were recruited for the trial. From these 67 participants, 122 eyes were tested. Main diagnoses were 19 eyes with corneal pathology (16%), glaucoma in 13 eyes (11%), 7 postoperative eyes (6%), cataract in 6 eyes (5%), and 4 eyes with dry eye syndrome (3%). There were 29 eyes (24%) without documented pathology.

The median logMAR visual acuity measured using the Snellen Chart function on EyeSnellen app was 0.097. The range measured –0.125 to 1.000, which is equivalent to a decimal range of 0.100 to 1.333. The median logMAR visual acuity measured using the Snellen light box chart was 0.176. The range measured was –0.176 to 1.000, which is equivalent to a decimal range of 0.100 to 1.500.

Bland-Altman analysis revealed a mean difference of 0.001 logMAR units between the visual acuity results from the iOS app and the light box chart with 95% limits of agreement of –0.169 to 0.171. (Figure 4)

Figure 4: Bland Altman plot of the difference versus mean logMAR visual acuity recorded using a traditional Snellen light box chart and the Snellen chart function on EyeSnellen app (n = 122 eyes)

Discussion

Bland-Altman analysis demonstrated agreement between visual acuity measured by Snellen chart on EyeSnellen and visual acuity measured by the Snellen light box chart. This result demonstrates that EyeSnellen can be used as an alternative to the traditional Snellen light box chart when vision is tested at 6 metres.

The large difference in median visual acuity measured between the EyeSnellen app and the Snellen light box chart may be explained by a limitation of the study. The 6/7.5 and the 6/4.5 visual acuity intervals were absent on the Snellen light box chart and the 6/5 and 6/4 intervals were absent on the EyeSnellen app. The calculated median result for EyeSnellen equated to the 6/7.5 interval (which was not a provided interval on the light box chart) whereas the median result calculated for the light box chart was 6/9. Given that 6/7.5 and 6/9 are neighbouring intervals it may be highly likely that eyes assessed to be 6/9 on the light box chart may in fact have tested to be 6/7.5 had the interval been available.

A possible source of bias is present due to the lack of masking of the patient or tester, a situation arising from clinic workflow constraints.

Our findings differ slightly from recent studies investigating the reliability of visual acuity measurements on a tablet device. Zhang et al concluded that the Eye Chart Pro iOS app is reliable for testing visual acuity when the decimal Snellen visual acuity was better than 0.16. Our results suggest the EyeSnellen iOS app is reliable for all visual acuities measureable on the Snellen Chart. Although we minimised glare by mounting the tablet device vertically, our results suggest an antiglare screen is not necessary which had been suggested by Black et al to obtain accurate visual acuity measurements7.

Interestingly, although the illumination of the iPad mini screen was measured at 200 lux (below many recommended national standards8,9) its visual acuity measurements were still comparable to the light chart which had a measured illumination of 600 lux. The difference in illumination between both charts may have influenced visual acuity measurements. A study comparing different chart luminance levels suggests that doubling of the luminance level within a range of 40 to 600 lux improves measurements of visual acuity by approximately one letter on a five letter row10.

Some advantages of the EyeSnellen app were noticed during testing. The remote function allowed randomisation of optotypes, which removed the chance of patients recalling optotypes from memory. Another advantage of the app allowed assessors to observe the letters and visual acuity interval on the remote, which made the recording of visual acuity easier.

Conclusion

The Snellen chart function on EyeSnellen app can be reliably used to measure visual acuity in clinical settings. Furthermore, the application may be more advantageous than traditional light box charts due to its portability and the ability to randomise optotypes.

Acknowledgements

The authors would like to thank the staff and patients of the Fremantle Hospital Ophthalmology Department for their patience and support in conducting this research study.

References

1. Colenbrander A. The Historical evolution of Visual Acuity Measurement. The Smith-Kettlewell Eye Research Institute. 2001. http://www.ski.org/Colen brander/Images/History_VA_Measuremnt.pdf (Accessed June 2013).

2. Eye Apps website; Stephen Colley, 2013. Available at: http://www.eyeapps.com.au (Accessed March 2014).

3. Zhang ZT, Zhang SC, Huang XG, et al. A pilot trial of the iPad tablet computer as a portable device for visual acuity testing. J Telemed Telecare 2013 Jan;19(1):55–9.

4. Black JM, Jacobs RJ, Phillips G et al. An assessment of the iPad as a testing platform for distance visual acuity in adults [Internet]. BMJ Open. 2013 [cited 2014 Mar 6];3(6). Available from: BMJ

5. The R Project for Statstical Computing (Internet). www.r-project.org (Accessed March 2014)

6. Zhang ZT, Zhang SC, Huang XG, et al. A pilot trial of the iPad tablet computer as a portable device for visual acuity testing. J Telemed Telecare 2013 Jan;19(1):55–9.

7. Black JM, Jacobs RJ, Phillips G et al. An assessment of the iPad as a testing platform for distance visual acuity in adults [Internet]. BMJ Open. 2013 [cited 2014 Mar 6];3(6). Available from: BMJ.

8. New Zealand Government. Medical Aspects of fitness to drive. New Zealand Transport Agency, 2009 Jul. 139p.

9. Canadian Medical Assocation. CMA driver’s guide: Determining Medical Fitness to Operate Motor Vehicles, 8th Edition. 2012. 134p.

10. Sheedy JE, Bailey IL, Raasch TW. Visual acuity and chart luminance. Am J Optom Physiol Opt 1984 Sep;61(9):595–600.

Read More

Posted on Jul 27, 2014 in Original Article | 0 comments

Smartphone and medical applications use by contemporary surgical trainees: A national questionnaire study


TH Carter, (BSc Hons, MBChB)1, MA Rodrigues, (BSc Hons, MBChB)1, AGN Robertson, (MRCS (Ed), PhD)1, RRW Brady, (MBChB, MRCS (Ed))1, on behalf of Scottish Surgical Research Group (SSRG)

1Department of Clinical Surgery, Royal Infirmary of Edinburgh, Little France, Edinburgh UK

Corresponding Author: carter.tom@doctors.org.uk

Journal MTM 3:2:2–10, 2014

doi:10.7309/jmtm.3.2.2


Background: Smartphones provide a diverse range of functions, including the ability to communicate rapidly, store information and consult online medical applications (apps). Whilst their use by doctors is popular, there is little data on their clinical use and application by surgical trainees.

Aims: Here we assess smartphone ownership, usage in clinical environments, medical app download patterns, and knowledge of current app regulation by surgical trainees.

Methods: An online questionnaire was distributed to all core and specialty NHS general surgical trainees working in Scotland.

Results: Thirty three percent (76/233) of trainees responded. Ninety two percent owned a smartphone. Trainees used smartphones at work for email (96%), calls (85%), SMS/MMS (81%), Internet browsing (76%) and medical app access (55%). Eighty two percent of respondents had downloaded at least one app, including clinical guidelines (70%), medical calculators (59%), anatomy guides (50%) and study aids (32%). There was no statistical difference between demographics and smartphone use or app downloads. Thirty five percent had used apps to help make clinical decisions. Thirteen percent felt they had encountered erroneous outputs, according to their own judgement and/or calculation. Fifty eight percent felt apps should be compulsorily regulated however only one trainee could name a regulatory body.

Conclusion: Smartphone possession amongst NHS surgical trainees is high. Knowledge of app regulation is poor, with potential safety concerns regarding inaccurate outputs. Integration of apps, developed and approved by an appropriate authority, may improve confidence when integrating them into training and healthcare delivery.


Read More