Pages Menu

Posted on Jul 27, 2014 in Original Article | 0 comments

Validation of a Portable Electronic Visual Acuity System

Pavindran A Gounder, MBBS1, Eliza Cole, MBBS2, Stephen Colley, MBBS, FRANZCO3,
David M Hille, Msc(Oxon)4

1Fremantle Hospital; 2Fremantle Hospital; 3Fremantle Hospital; 4Medical Student, University of Western Australia, WA, Australia

Corresponding author: pav.gounder@gmail.com

Journal MTM 3:2:35–39, 2014

doi:10.7309/jmtm.3.2.6


Background: The use of tablet devices and smartphones in medicine as assessment tools is becoming more widespread. These devices now run mobile applications or “apps” that have traditionally been the domain of desktop computers or more dedicated hardware. It is important that health professionals have confidence in the accuracy of measurements obtained from these new tools. The “EyeSnellen” app for the iPhone/iPad (running Apple Inc’s iOS operating system) allows users to measure visual acuity using a portable Snellen chart installed on a tablet device.

Aims: To compare the visual acuity measurements obtained from EyeSnellen iPad app with a standard illuminated Snellen Chart.

Methods: Participants were recruited from a tertiary level eye clinic in Western Australia. Visual acuity was measured using the Snellen light box chart and a visual acuity measurement was obtained using EyeSnellen app installed on an Apple iPad mini with the use of an Apple Iphone as a remote that was connected via Bluetooth.

Results: 122 eyes were tested. Bland-Altman analysis revealed a mean difference of 0.001 logMAR units between the visual acuity measurements obtained from EyeSnellen app and those taken on the light box chart with 95% limits of agreement of –0.169 to 0.171.

Conclusion: The Snellen Chart function on EyeSnellen app is equivalent to the traditional Snellen chart at measuring visual acuity at a test distance of 6 metres.


Introduction

Measurement of visual acuity provides a screening tool for the diagnosis of underlying disease and can be used as a predictor of the functional consequences of visual loss1. It is the first of the “vital signs” of ophthalmology. The original Snellen chart was developed in 1862 by Dr Herman Snellen and since that time many variations have been proposed and considered.

Since the advent of Smartphones and tablet devices, ‘apps’ have been used to simplify many existing daily tasks. In medicine there are an increasing number of uses for these devices and apps are now used widely as resources for learning and tools for improving clinical assessment and treatment. Currently there are multiple apps available worldwide for testing visual acuity however few have been standardised and validated for use.

The EyeSnellen app was developed by Dr Stephen Colley (www.eyeapps.com.au), a Western Australian Ophthalmologist, and released on the iTunes App store in December 20122. It uses an iPad to display the Snellen chart and an iPhone or iPod as a remote device via Bluetooth. There have been regular updates with new features and the app is currently version 1.6 (as of December 2013). There have been over 9500 downloads as of March 2014.

To date, there have been two published studies comparing visual acuity estimates using a standard eye chart and an eye chart on an iPad/tablet device. The first, a study conducted in a Chinese ophthalmic centre, compared an iOS app (Eye Chart Pro) against a tumbling E light box chart3. Their study collected measurements from 240 eyes and concluded that the Eye Chart Pro app was reliable for visual acuity testing when the Snellen visual acuity was better than a decimal visual acuity of 0.1. The second study, conducted in New Zealand, collected visual acuity measurements on patients without ocular pathology4. The study concluded that tablet computer devices were only suitable for use in situations where sources of glare could be eliminated. There has not been a study validating the use of a Snellen chart on a tablet device.

The portability of tablet devices also makes them ideal for remote and rural health care settings and for mobile screening units.

We hypothesized that the EyeSnellen iPad tool was comparable to the traditional Snellen chart at measuring visual acuity at a test distance of 6 metres.

Methods

The study was approved by the South Metropolitan Health Service Human Research Ethics Committee. All participants provided informed consent before participating in the study.

Participants were recruited from presentations to the Fremantle Hospital Eye Clinic over a period of two weeks. Patients were excluded from participating if they were below the age of 16, English was their second language or if their visual acuity was worse than measureable on the Snellen Chart.

Visual acuity was assessed using the Snellen Chart function on the EyeSnellen iOS app (ver 1.6) installed on a second generation Apple iPad mini and using a traditional Snellen light box chart. The Snellen Chart function was chosen as it is the most commonly used chart for testing acuity of vision in Western Australian ophthalmology clinics.

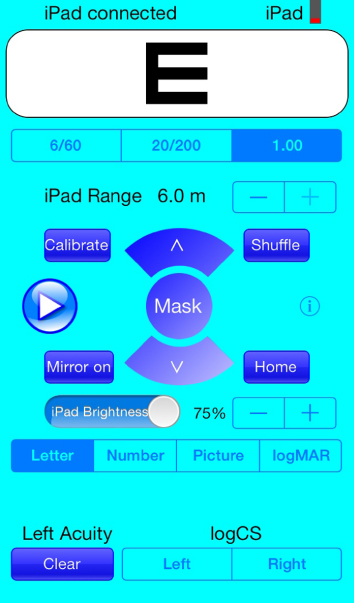
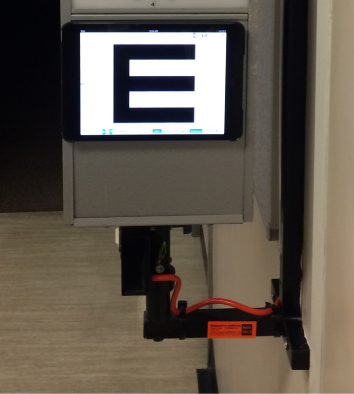
EyeSnellen was installed on a first generation iPad mini (163 pixels pwer inch, 160 mm × 120 mm screen seize) and an Apple iPhone 5S was used as a wireless remote control for the use of the chart on the Apple iPad mini. The brightness was set to 75% using an in app control which gave an illumination of 200 lux when measured with a light meter. Visual acuity intervals provided by EyeSnellen app were 6/60, 6/36, 6/24, 6/18, 6/12, 6/9, 6/7.5, 6/6 and 6/4.5. The iPad mini was mounted with Velcro onto a light box chart using a Belkin Shield Sheer Matte Case. (Figure 1, Figure 2)

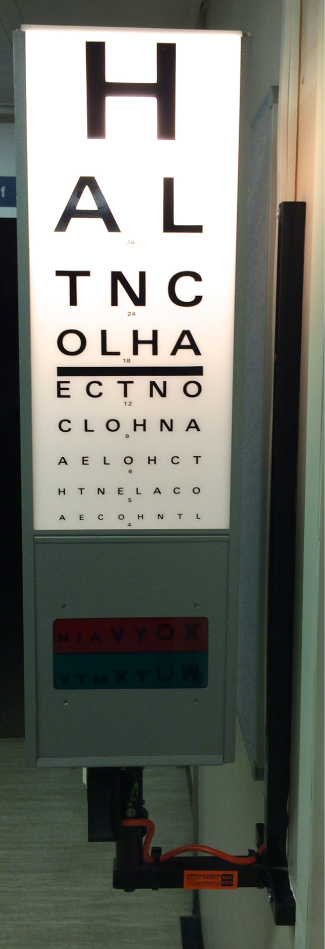
Figure 1: EyeSnellen iOS application displayed on an iPad mini that was mounted to a traditional lightbox with the use of Velcro and a case

Figure 2: Screenshot from Apple iPhone 5S with EyeSnellen remote installed

The retro illuminated Snellen box chart provided an illumination of 600 lux. The measureable visual acuity intervals provided by the box chart were 6/60, 6/36, 6/24, 6/18, 6/12, 6/9, 6/6, 6/5 and 6/4. (Figure 3)

Figure 3: Snellen Light Box Chart

Visual acuity measurements were assessed and recorded by two resident medical officers.

Patients were instructed to stand 6 metres from both charts. A spectacle vision occluder was used to first test the right then left eye of patients. Patients were instructed to read each line until they were no longer able to resolve the optotype. A visual acuity measurement was recorded if the patient was able to read more than half the optotypes of a given line. Visual acuity was first assessed using EyeSnellen app and followed by a measurement using the traditional Snellen Chart. Neither the assessors nor the patients were masked for the outcome of the vision test. The same refractive correction was maintained for measurements with both charts (either unaided, habitual correction or pinholes).

Visual acuity measurements were recorded as decimals. Results were then converted to logMAR visual acuity for statistical analysis. R (Ver 3.0.2), a freely available statistical computer package5, was used to calculate the results.

Results

A total of 67 participants (average age 57, range 19–89) were recruited for the trial. From these 67 participants, 122 eyes were tested. Main diagnoses were 19 eyes with corneal pathology (16%), glaucoma in 13 eyes (11%), 7 postoperative eyes (6%), cataract in 6 eyes (5%), and 4 eyes with dry eye syndrome (3%). There were 29 eyes (24%) without documented pathology.

The median logMAR visual acuity measured using the Snellen Chart function on EyeSnellen app was 0.097. The range measured –0.125 to 1.000, which is equivalent to a decimal range of 0.100 to 1.333. The median logMAR visual acuity measured using the Snellen light box chart was 0.176. The range measured was –0.176 to 1.000, which is equivalent to a decimal range of 0.100 to 1.500.

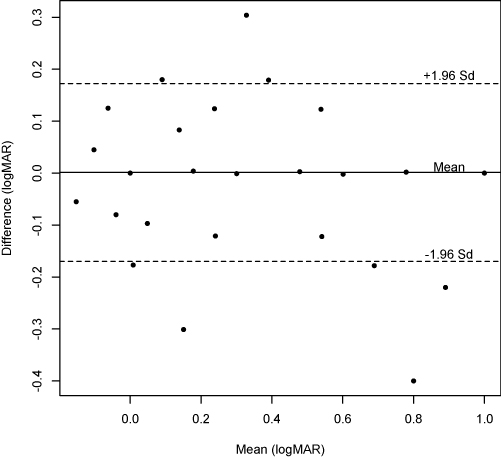
Bland-Altman analysis revealed a mean difference of 0.001 logMAR units between the visual acuity results from the iOS app and the light box chart with 95% limits of agreement of –0.169 to 0.171. (Figure 4)

Figure 4: Bland Altman plot of the difference versus mean logMAR visual acuity recorded using a traditional Snellen light box chart and the Snellen chart function on EyeSnellen app (n = 122 eyes)

Discussion

Bland-Altman analysis demonstrated agreement between visual acuity measured by Snellen chart on EyeSnellen and visual acuity measured by the Snellen light box chart. This result demonstrates that EyeSnellen can be used as an alternative to the traditional Snellen light box chart when vision is tested at 6 metres.

The large difference in median visual acuity measured between the EyeSnellen app and the Snellen light box chart may be explained by a limitation of the study. The 6/7.5 and the 6/4.5 visual acuity intervals were absent on the Snellen light box chart and the 6/5 and 6/4 intervals were absent on the EyeSnellen app. The calculated median result for EyeSnellen equated to the 6/7.5 interval (which was not a provided interval on the light box chart) whereas the median result calculated for the light box chart was 6/9. Given that 6/7.5 and 6/9 are neighbouring intervals it may be highly likely that eyes assessed to be 6/9 on the light box chart may in fact have tested to be 6/7.5 had the interval been available.

A possible source of bias is present due to the lack of masking of the patient or tester, a situation arising from clinic workflow constraints.

Our findings differ slightly from recent studies investigating the reliability of visual acuity measurements on a tablet device. Zhang et al concluded that the Eye Chart Pro iOS app is reliable for testing visual acuity when the decimal Snellen visual acuity was better than 0.16. Our results suggest the EyeSnellen iOS app is reliable for all visual acuities measureable on the Snellen Chart. Although we minimised glare by mounting the tablet device vertically, our results suggest an antiglare screen is not necessary which had been suggested by Black et al to obtain accurate visual acuity measurements7.

Interestingly, although the illumination of the iPad mini screen was measured at 200 lux (below many recommended national standards8,9) its visual acuity measurements were still comparable to the light chart which had a measured illumination of 600 lux. The difference in illumination between both charts may have influenced visual acuity measurements. A study comparing different chart luminance levels suggests that doubling of the luminance level within a range of 40 to 600 lux improves measurements of visual acuity by approximately one letter on a five letter row10.

Some advantages of the EyeSnellen app were noticed during testing. The remote function allowed randomisation of optotypes, which removed the chance of patients recalling optotypes from memory. Another advantage of the app allowed assessors to observe the letters and visual acuity interval on the remote, which made the recording of visual acuity easier.

Conclusion

The Snellen chart function on EyeSnellen app can be reliably used to measure visual acuity in clinical settings. Furthermore, the application may be more advantageous than traditional light box charts due to its portability and the ability to randomise optotypes.

Acknowledgements

The authors would like to thank the staff and patients of the Fremantle Hospital Ophthalmology Department for their patience and support in conducting this research study.

References

1. Colenbrander A. The Historical evolution of Visual Acuity Measurement. The Smith-Kettlewell Eye Research Institute. 2001. http://www.ski.org/Colen brander/Images/History_VA_Measuremnt.pdf (Accessed June 2013).

2. Eye Apps website; Stephen Colley, 2013. Available at: http://www.eyeapps.com.au (Accessed March 2014).

3. Zhang ZT, Zhang SC, Huang XG, et al. A pilot trial of the iPad tablet computer as a portable device for visual acuity testing. J Telemed Telecare 2013 Jan;19(1):55–9.

4. Black JM, Jacobs RJ, Phillips G et al. An assessment of the iPad as a testing platform for distance visual acuity in adults [Internet]. BMJ Open. 2013 [cited 2014 Mar 6];3(6). Available from: BMJ

5. The R Project for Statstical Computing (Internet). www.r-project.org (Accessed March 2014)

6. Zhang ZT, Zhang SC, Huang XG, et al. A pilot trial of the iPad tablet computer as a portable device for visual acuity testing. J Telemed Telecare 2013 Jan;19(1):55–9.

7. Black JM, Jacobs RJ, Phillips G et al. An assessment of the iPad as a testing platform for distance visual acuity in adults [Internet]. BMJ Open. 2013 [cited 2014 Mar 6];3(6). Available from: BMJ.

8. New Zealand Government. Medical Aspects of fitness to drive. New Zealand Transport Agency, 2009 Jul. 139p.

9. Canadian Medical Assocation. CMA driver’s guide: Determining Medical Fitness to Operate Motor Vehicles, 8th Edition. 2012. 134p.

10. Sheedy JE, Bailey IL, Raasch TW. Visual acuity and chart luminance. Am J Optom Physiol Opt 1984 Sep;61(9):595–600.

Read More

Posted on Jul 27, 2014 in Original Article | 0 comments

Smartphone and medical applications use by contemporary surgical trainees: A national questionnaire study


TH Carter, (BSc Hons, MBChB)1, MA Rodrigues, (BSc Hons, MBChB)1, AGN Robertson, (MRCS (Ed), PhD)1, RRW Brady, (MBChB, MRCS (Ed))1, on behalf of Scottish Surgical Research Group (SSRG)

1Department of Clinical Surgery, Royal Infirmary of Edinburgh, Little France, Edinburgh UK

Corresponding Author: carter.tom@doctors.org.uk

Journal MTM 3:2:2–10, 2014

doi:10.7309/jmtm.3.2.2


Background: Smartphones provide a diverse range of functions, including the ability to communicate rapidly, store information and consult online medical applications (apps). Whilst their use by doctors is popular, there is little data on their clinical use and application by surgical trainees.

Aims: Here we assess smartphone ownership, usage in clinical environments, medical app download patterns, and knowledge of current app regulation by surgical trainees.

Methods: An online questionnaire was distributed to all core and specialty NHS general surgical trainees working in Scotland.

Results: Thirty three percent (76/233) of trainees responded. Ninety two percent owned a smartphone. Trainees used smartphones at work for email (96%), calls (85%), SMS/MMS (81%), Internet browsing (76%) and medical app access (55%). Eighty two percent of respondents had downloaded at least one app, including clinical guidelines (70%), medical calculators (59%), anatomy guides (50%) and study aids (32%). There was no statistical difference between demographics and smartphone use or app downloads. Thirty five percent had used apps to help make clinical decisions. Thirteen percent felt they had encountered erroneous outputs, according to their own judgement and/or calculation. Fifty eight percent felt apps should be compulsorily regulated however only one trainee could name a regulatory body.

Conclusion: Smartphone possession amongst NHS surgical trainees is high. Knowledge of app regulation is poor, with potential safety concerns regarding inaccurate outputs. Integration of apps, developed and approved by an appropriate authority, may improve confidence when integrating them into training and healthcare delivery.


Read More

Posted on Jul 27, 2014 in Original Article | 0 comments

Internet and smartphone delivery of core trunk exercises for a randomised clinical trial: protocol

Margaret Agnes Perrott, M Sports Physio, M App Sci1, Tania Pizzari, PhD2, Jill Cook, PhD3

1Department of Physiotherapy, La Trobe University, Bundoora, Vic. 3086; 2Department of Physiotherapy, La Trobe University, Bundoora, Vic. 3086; 3Faculty of Medicine, Nursing and Health Sciences, Monash University, Frankston, Vic. 3199

Corresponding author m.perrott@latrobe.edu.au

Journal MTM 3:2:46–54, 2014

doi:10.7309/jmtm.3.2.8


Background: Lumbopelvic stability exercises are commonly prescribed for athletes to prevent sports injury; however, there is limited evidence that exercises are effective. Exercise trials are time consuming and costly to implement when teaching exercises or providing feedback directly to participants. Delivery of exercise programs using mobile technology potentially overcomes these difficulties.

Aims: To evaluate the qualitative clinical changes and quantitative movement pattern changes on lumbopelvic stability and injury in recreational athletes following exercise. It is hypothesised that athletes who complete the stability training program will improve their clinical rating of lumbopelvic stability, quantitatively improve their movement patterns and have fewer injuries compared to those who complete the stretching program.

Methods: One hundred and fifty recreational athletes will be recruited for the trial. Direct contact with researchers will be limited to three movement test sessions at baseline, 12 weeks and 12 months after baseline. Videoed performance of the tests will be accessed from an internet data storage site by researchers for clinical evaluation of lumbopelvic stability. Those without good stability at baseline will be randomly allocated to one of two exercise groups. The exercise programs will be delivered via the internet. Feedback on correct performance of the exercises will be provided using a smartphone software application. Injury will be monitored weekly for 12 months using text messages.

Conclusion: The trial protocol will establish if an exercise training program improves lumbopelvic stability and reduces injury. Improvement in lumbopelvic stability following an exercise program delivered with mobile technology will enable the provision of exercise programs to other athletes who may be geographically remote from their exercise provider and establish a method for researchers and health professions to use for exercise programs for individuals with other health conditions.

Trial Registration: ACTRN12614000095662


Background

Lumbopelvic stability (LPS) has been defined as the ability of an individual to maintain optimal alignment of the spine, pelvis, and the thigh in both a static position and during dynamic activity1. Clinically, there is a perception that LPS is an essential component of injury prevention, and training LPS is thought to aid recovery from injury and improve performance2. Deficits in LPS have been associated with injury or pain in the back, groin and knee310 and exercise for the lumbopelvic region can reduce the risk of muscle strain injury11 and improve the gold standard quantitative measure of movement: three dimensional kinematics12,13.

Although evidence demonstrates that the performance of single leg squat (SLS), a key measure of LPS, can be changed by exercise12, it is uncertain if a training program focused solely on LPS can improve an athlete’s qualitative clinical rating of LPS when assessed by physiotherapists or will be validated by improved kinematic measures. It is also uncertain if isolated LPS training reduces the risk of injury. This trial aims to establish whether an LPS exercise program improves an athlete’s qualitative and quantitative performance of specific LPS tests and whether injury is reduced by improvement in LPS.

A barrier to implementing randomised controlled clinical exercise trials is the time consuming and costly nature of teaching exercises directly to research participants14. The use of mobile technology has the potential to overcome these barriers and to standardise the exercises that are taught15. This trial will use mobile technology, both internet and smartphone, in delivery of exercise programs, for providing feedback on exercise technique and for injury monitoring.

Methods

A single-blinded parallel randomised controlled trial (Figure 1) will compare the effect of two exercise programs in participants who have deficient LPS. The trial protocol has been approved by the La Trobe University Faculty Human Ethics Committee and all participants will give informed consent before taking part (Reference: FHC13/121) and registered with Australian New Zealand Clinical Trials Registry (ACTRN12614000095662).
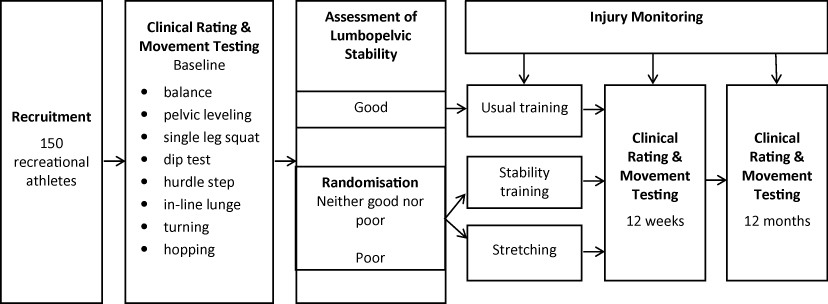
Figure 1: Participant flow chart

Rating of Lumbopelvic Stability

One hundred and fifty healthy male and female recreational athletes will be recruited for a randomised controlled clinical trial. They will complete baseline movement testing of eight movement tests. Performance of two tests: SLS and dip test will be videoed by the lead researcher (MP) and uploaded to a Dropbox™ shared with two other researchers (T.P., J.C.). To protect the security of data, Dropbox uses Secure Sockets Layer (SSL) and AES-256 bit encryption to transfer and store data16, making this an ethically acceptable way for the researchers to view the video performance.

The researchers will rate the individual’s LPS as good, poor or neither good nor poor. The rating classification system has been previously validated17. Rating LPS using video eliminates the need for the raters to be present at each movement test or for the participants to perform the tests multiple times for individual raters. This method has been used previously by these researchers17,18 Individuals classified as having good lumbopelvic stability will continue their usual training. All other participants will be randomly allocated to one of two exercise groups focused on the lumbopelvic region: stability training or stretching program. The exercise programs run for 12 weeks and are performed 3 times per week at home. The exercises take less than 15 minutes to perform. Allocation to exercise groups will be performed immediately after the clinical rating of LPS. Group allocation will be concealed by using an off-site trial administrator who holds the randomisation schedule. This administrator will not have any other role in the trial.

Randomisation

Stratified-block randomisation in groups of 20 will be performed using a random sequence generator at http://www.random.org/sequences. Stratification will be based on clinical rating of LPS: poor or neither good nor poor. This randomisation will ensure that similar numbers of participants with poor LPS or neither good nor poor LPS will be randomised to each exercise group. Differences in baseline LPS may influence the outcome of the trial rather than the intervention alone19.

Blinding

The researchers rating the LPS of participants at the 12 week and 12 month post intervention testing will be blinded to group allocation. The researchers assessing the outcomes and analysing the results data will also be blinded to group allocation.

Movement testing

Participants will attend three testing sessions, baseline, at the completion of the intervention at 12 weeks, and 12 months after baseline testing, to evaluate movement patterns in eight movement tests. This testing will be performed using the Organic Motion system (Organic Motion, New York, USA). This system records movement with gray scale cameras (120 Hz), develops a morphological and kinematic model of the participant, generates a body shape and matches it with a joint centre model from which angular changes in body segments can be extracted20. The system can report details of movement characteristics known to discriminate between good and poor LPS17.

Movement Tests

Eight movement tests have been chosen for the trial as they challenge control of the lumbopelvic region and their performance may be influenced by improvement in LPS. Six have previously been described: balance on one leg with eyes closed21,22, SLS23, dip test24, hurdle step and in-line lunge25 and side-to-side hopping26. Two additional tests will be performed: a turning manoeuvre and a pelvic leveling test. The turning manoeuvre will replicate typical sporting activity27 with the participants performing a running v-shaped turn. The pelvic leveling test is based on tests of postural control 28 where the participant stands on one leg, raises and lowers one side of their pelvis and attempts to return their pelvis to a level position. Participants will warm-up with 5 minutes walking at a comfortable speed on a treadmill while watching a video on correct performance of the tests, and then practice each test. The tests will be performed on each leg in random order.

Baseline Testing

1. Clinical assessment

The performance of SLS and dip test will be rated for LPS. Three other tests: balance, hurdle step and in-line lunge will be videoed and a clinical score recorded using validated rating systems. The balance test is scored with a point for each of 6 possible error types using the Balance Error Scoring System (BESS), with zero being the best possible score21. Hurdle step and in-line lunge are both scored from zero to three, with three being the best possible score25.

2. Kinematic assessment

Kinematic measures of three planes of movement of the back, pelvis and thigh will be recorded during the eight movement tests using the Organic Motion markerless motion capture system.

Follow-Up Testing

The same assessment of clinical rating of LPS, clinical scores from 5 movement tests and kinematic measures from all movement tests will be performed for all participants at 12 weeks and 12 months after their inclusion in the trial, including those with good LPS who are continuing their usual training.

Adherence and Injury Monitoring with Mobile Technology

Mobile telephone technology (text messaging) will be used to collect data on exercise adherence and to monitor sporting injuries during the 12 months of the trial. Weekly text messages will be sent to all participants. During the exercise programs the participants will be asked via text message how many times they have performed the exercises that week, with the options of replying “0”, “1”, “2”, or “3”. Also throughout the trial they will be asked if they have sustained a sports injury during the week, with the option to reply “injury” or “no injury”. Therefore, for example, they may reply “3 no injury”. This simple text message response mechanism will assist in keeping participants engaged in the trial with encouragement for prompt reply being rewarded by entry into a weekly prize draw. External observation by text message communication is expected to increase the commitment of participants to perform the exercises29. If participants reply that they have been injured the lead researcher will contact them via phone to identify the nature of the injury and refer them to an appropriate health practitioner for treatment.

Mobile Delivery of Exercise Programs and Feedback

After LPS rating, participants will be randomised to an exercise group. The exercise programs will be delivered to the participants with a link to one of two Dropbox internet sites: one for stability exercise and one for stretching exercise. At the site participants will access two types of video file: first, preliminary instructions and second, video of each exercise routine. The preliminary instructions include examples of correct technique and the number of repetitions to be performed. The stability exercise video also includes instructions on how to progress the exercises through four levels of difficulty. The exercise routine videos show exact timing and technique and allow the participant to exercise in conjunction with the video, providing a model to match. Participants will also be given written instructions and a poster showing either the stability exercises or the stretching exercises and the numbers of exercises and sets to be performed.

Feedback on correct exercise technique will be provided using an app, Coach’s Eye (TechSmith Corporation, Michigan, USA), that can be downloaded to smartphones, iPad and tablets. This app provides visual and verbal feedback on exercise technique that is provided directly to the participant’s smart phone. The system is operational on iOS, android and windows operating systems. The app provider has established a list of recommended devices on which the app is fully operational. If a participant has a smart phone that does not function correctly with the app, the participant will be able to video their performance on their phone, send to the lead researcher and receive visual feedback via email image that is indistinguishable from the Coach’s eye app. Written feedback will also be given in the email. Consistency of feedback across participants is regarded as important so that participants are able to access the same level of involvement in the project29. Feedback on exercise technique will be available at any time during the 12 week exercise program and will give participants the opportunity to report difficulty with performance of the exercises.

Stability Training Program

The participants allocated to this group will be asked to perform a 12 week LPS training program 3 times per week at home (Table 1). They will perform 1–2 sets of 5–12 repetitions of the exercises.
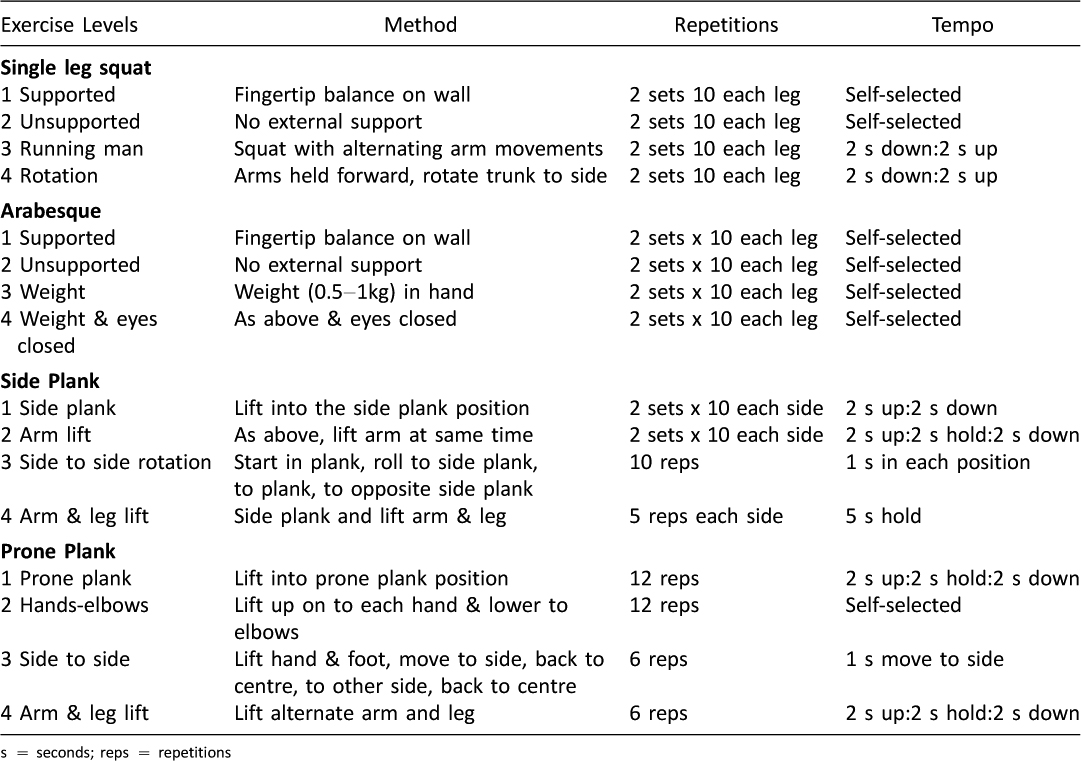
Table 1: Stability training program

The stability training program comprises four exercises, each of which has four levels. The exercises are SLS, arabesque, side plank and prone plank (Figures 2a–d).The exercises commence in well-supported positions, performing only small movements and progress to increasingly challenging exercises with larger ranges of movement in positions that challenge LPS. Each exercise has criteria describing competent performance. The participants will progress at their own rate to the next level when competent at that level. Participants may not reach the highest level of each exercise during the 12 weeks.
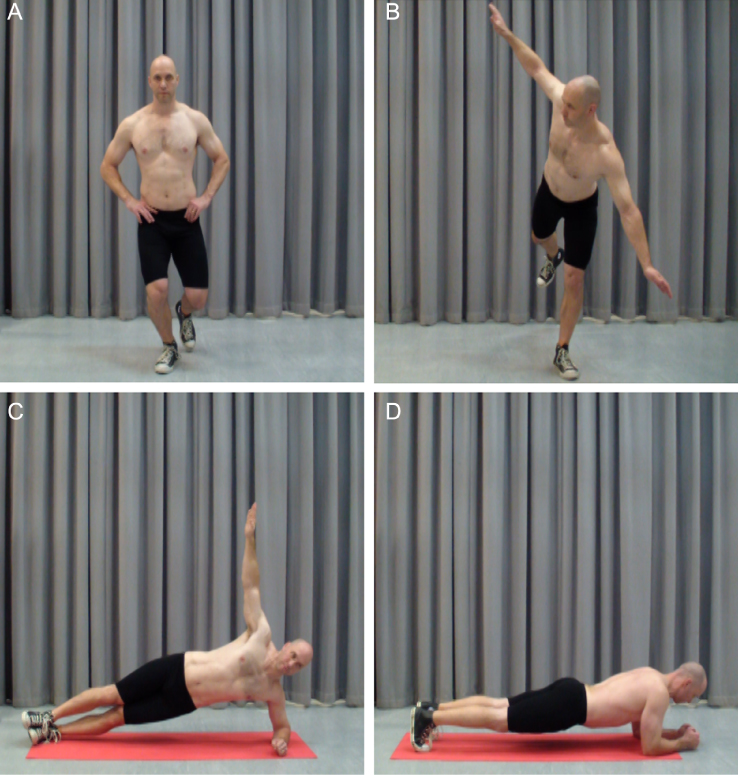
Figure 2: Stability exercises a. Single leg squat, b. Arabesque, c. Side plank, d. Prone plank

Stretching Training Program

The participants allocated to this group will be asked to perform a 12 week stretching training program 3 times per week at home. The stretching training program comprises stretches for six muscle groups attached to the lumbopelvic region: hamstrings, quadriceps, adductors, gluteals, trunk rotators and hip flexors (Figures 3a–f) and have been described previously30. The participants should feel a strong but comfortable stretch and hold each stretch for 30 seconds. The stretches will be performed on each side.

Figure 3: Stretching exercises a. Hamstrings, b. Quadriceps, c. Adductors, d. Gluteals, e. Trunk rotators, f. Hip flexors

Power calculation: sample size

One hundred and fifty recreational athletes will be recruited. The sample size is based on the clinically relevant ability to detect change in lumbopelvic stability after stability training in those with poor stability. Previous research shows a range of sample sizes from 21–42 where stability training changed isolated aspects of LPS7, 31, 32, or reduced pain and disability33.

This sample size range is supported by a power calculation based on research investigating the effect of a stability and agility program compared to a stretching program on recurrent hamstring strain34. To detect differences between the two interventions in the current study and achieve a power of 0.8 at an alpha level of 0.05, df = 1, using chi square, a sample size of 19 with poor LPS would be required35. This sample size is likely to be insufficient for the current study since the hamstring study was limited to a specific population with a high risk of re-injury who were closely supervised in their performance of their exercise program. Therefore a larger sample size will be chosen for the current trial.

A sample size of 150 participants should yield 34 participants with poor LPS. This is based on a study by the current researchers that yielded 14 individuals with poor LPS, 9 with good LPS and 39 with neither good nor poor stability from a population of 62 recreational athletes17. This should ensure a large enough sample size to detect change in LPS in those with poor LPS. The power of the trial is increased by basing the sample size only on detecting change in those with poor LPS, as change in LPS in those with neither good nor poor stability will also be examined in this trial.

Data analysis: clinical rating

Clinical rating of LPS (good, poor or neither good nor poor) will be compared before and after intervention using Chi square. Performance scores for balance, hurdle step and in-line lunge will be compared before and after intervention using Friedman two-way analysis of variance by ranks.

The correlation between clinical LPS rating and performance scores will be analysed using Spearman rho at baseline, 12 weeks and 12 months to establish if there is an association between clinical rating and performance scores on other tests. The alpha level will be set at p ≤ 0.05 for all statistical tests.

Data analysis: kinematic measures

Kinematic measures related to lumbopelvic stability will be compared before and after intervention using mixed two-way ANOVA (group by time). This comparison will be made at baseline, 12 weeks and 12 months to determine if an exercise program changes the amount that athletes move. Movement patterns will be analysed on each leg with skill and stance legs36 analysed separately.

Data analysis: injury rate and adherence

The association between baseline rating of LPS and subsequent sports injury will be analysed using Chi square. Adherence to the exercise programs will be reported as a percentage of the 36 expected exercise sessions. Exercise adherence will be used as a covariate in analysis of change in clinical rating and injury rate.

Conclusion

This randomised controlled trial will examine the effectiveness of an exercise program designed to improve LPS compared to a control exercise program in recreational athletes. It is expected that the stability program will be more effective in improving LPS, changing movement patterns and reducing injury than the stretching program.

The trial is dependent on the use of mobile technology, both internet and smartphone, to deliver the exercise program instructions and technique, to provide feedback on exercise technique and to monitor exercise adherence and injury. Exercise trials that rely on teaching exercise programs face to face or that require participants to attend exercise groups are expensive and time consuming to conduct for both researchers and participants. The use of text messages simplifies the process of monitoring adherence and injury rather than the use of exercise/injury diaries. The ability to deliver the randomised controlled trial in a time and cost effective manner has implications for first, the specific outcome of this trial on lumbopelvic stability and second, for exercise trials for other health conditions. If the LPS exercise program is successful in changing LPS and also in reducing injury this provides an effective method to make the exercise program available for the general sporting community. It would also be possible for individuals to perform the important movement tests that enable them to be classified as having good, poor or neither good nor poor LPS at home and send them via the Coach’s Eye app to be assessed. If they do not have good LPS they could be provided with the stability exercise program via the internet and receive feedback with the app. This enables athletes who are geographically remote from skilled physiotherapists to access proven exercise techniques for their LPS. In addition to the direct outcome of this trial, other researchers or health professionals can use the methods in this protocol to establish exercise programs for other health conditions by videoing correct performance of exercise technique to deliver the exercise programs and provide feedback using mobile technology.

The trial will be reported in accordance with the CONSORT group statement.

Trial status

At the time of manuscript submission recruitment of participants had not commenced.

General Disclosure Statement

Ms Perrott and Dr. Pizzari have nothing to disclose. Prof. Cook reports a relevant financial activity outside the submitted work as a director of company that has interests in tendon imaging and management.

Video Links

http://youtu.be/d_6xRbu83r8

http://youtu.be/LcMyL4tkPgc

http://youtu.be/i6Slpw67vK0

http://youtu.be/LQnDWRmtjek

http://youtu.be/sMLIifMuOw0

References

1. Perrott M, Pizzari T, Cook J, Opar MS. Development of clinical rating criteria for tests of lumbo-pelvic stability. Rehabilitation Research and Practice [Internet]. 2011 [cited 2012 May 29]. Available from: http://www.hindawi.com/journals/rerp/2012/803637/.

2. Willardson JM. Core stability training: Applications to sports conditioning programs. J Strength Cond. 2007;21(3):979–85.

3. Biering-Sorenson F. Physical measurements as risk indicators for low-back trouble over a one year period. Spine. 1984;9(2):108–19.

4. Bolgla LA, Malone TR, Umberger BR, Uhl TL. Hip strength and hip and knee kinematics during stair descent in females with and without patellofemoral pain syndrome. J Orthop Sports Phys Ther. 2008;38(1):12–8.

5. Cowan SM, Schache AG, Brukner P, Bennell KL, Hodges PW, Coburn P, et al. Delayed onset of transversus abdominus in long-standing groin pain. Med Sci Sports Exerc. 2004;36(12):2040–5.

6. Evans C, Oldreive W. A study to investigate whether golfers with a history of low back pain show a decreased endurance of transversus abdominus. J Man Manip Ther. 2000;8(4):162–74.

7. Hides JA, Richardson CA, Jull GA. Multifidus muscle recovery is not automatic after resolution of acute, first-episode low back pain. Spine. 1996;21(23):2763–9.

8. Hodges PW, Richardson CA. Inefficient muscular stabilization of the lumbar spine associated with low back pain. Spine. 1996;21(22):2640–50.

9. Leetun DT, Ireland ML, Willson JD, Ballantyne BT, Davis IM. Core stability measures as risk factors for lower extremity injury in athletes. Med Sci Sports Exerc. 2004;36(6):926–34.

10. Zazulak BT, Hewett TE, Reeves NP, Goldberg B, Cholewicki J. Deficits in neuromuscular control of the trunk predict knee injury risk: a prospective biomechanical-epidemiologic study. Am J Sports Med. 2007;35(7):1123–30.

11. Perrott MA, Pizzari T, Cook C. Lumbopelvic exercise reduces lower limb muscle strain injury in recreational athletes Phys Ther Rev. 2013;18(1):24–33.

12. Baldon RD, Lobato DF, Carvalho LP, Wun PY, Santiago PR, Serrao FV. Effect of functional stabilization training on lower limb biomechanics in women. Med Sci Sports Exerc. 2012;44(1):135–45.

13. Shirey M, Hurlbutt M, Johansen N, King GW, Wilkinson SG, Hoover DL. The influence of core musculature engagement on hip and knee kinematics in women during a single leg squat. Int J Sports Phys Ther. 2012;7(1):1–12.

14. McTiernan A, Schwartz RS, Potter J, Bowen D. Exercise clinical trials in cancer prevention research: a call to action. Cancer Epidemiol Biomarkers Prev. 1999;8(3):201–7.

15. Parker M. Use of a tablet to enhance standardisation procedures in a randomised trial. Journal of MTM. 2012;1(1):24–6.

16. How secure is Dropbox? 2014 [cited 2014 17/5/2014]. Available from: https://www.dropbox.com/help/27/en.

17. Perrott MA. Development and evaluation of rating criteria for clinical tests of lumbo-pelvic stability [electronic resource] [Masters Thesis]. Melbourne: La Trobe University; 2010.

18. Perrott MA, Cook J, Pizzari T, editors. Clinical rating of poor lumbo-pelvic stability is associated with quantifiable, distinct movement patterns. Australian Conference of Science and Medicine in Sport; 2009; Brisbane: Sports Medicine Australia.

19. Kernan WN, Viscoli CM, Makuch RW, Brass LM, Horwitz RI. Stratified randomization for clinical trials. J Clin Epidemiol. 1999;52(1):19–26.

20. Mundermann A, Mundermann L, Andriacchi TP. Amplitude and phasing of trunk motion is critical for the efficacy of gait training aimed at reducing ambulatory loads at the knee. J Biomech Eng. 2012;134(1):011010.

21. Finnoff JT, Peterson VJ, Hollman JH, Smith J. Intrarater and interrater reliability of the Balance Error Scoring System (BESS). Pm R. 2009;1(1):50–44.

22. Riemann BL, Guskiewicz K, Shields EW. Relationship between clinical and forceplate measures of postural stability JSR. 1999;8(2):71–82.

23. Zeller BL, McCrory JL, Kibler WB, Uhl TL. Differences in kinematics and electromyographic activity between men and women during the single-legged squat. Am J Sports Med. 2003;31(3):449–56.

24. Harvey D, Mansfield C, Grant M. Screening test protocols: pre-participation screening of athletes. Canberra: Australian Sports Commission; 2000.

25. Cook G, Burton L, Hoogenboom B. Pre-participation screening: the use of fundamental movements as an assessment of function – part 1. N Am J Sports Phys Ther. 2006;1(2):62–72.

26. Itoh H, Kurosaka M, Yoshiya S, Ichihashi N, Mizuno K. Evaluation of functional deficits determined by four different hop tests in patients with anterior cruciate ligament deficiency. Knee Surg Sport Tr A. 1998;6(4):241–5.

27. Muller C, Sterzing T, Lake M, Milani TL. Different stud configurations cause movement adaptations during a soccer turning movement. Footwear Sci. 2010;2(1):21–8.

28. Stevens VK, Bouche KG, Mahieu NN, Cambier DC, Vanderstraeten GG, Danneels LA. Reliability of a functional clinical test battery evaluating postural control, proprioception and trunk muscle activity. Am J Phys Med Rehabil. 2006;85(9):727–36.

29. Lied TR, Kazandjian VA. A Hawthorne strategy: implications for performance measurement and improvement. Clin Perform Qual Health Care. 1998;6(4):201–4.

30. Herbert RD, Gabriel M. Effects of stretching before and after exercising on muscle soreness and risk of injury: systematic review. BMJ. 2002;325(7362):468.

31. Hides JA, Stanton W, McMahon S, Sims K, Richardson CA. Effect of stabilization training on multifidus muscle cross-sectional area among young elite cricketers with low back pain. J Orthop Sports Phys Ther. 2008;38(3):101–8.

32. Stanton R, Reaburn PR, Humphries B. The effect of short-term Swiss ball training on core stability and running economy. J Strength Cond Res. 2004;18(3):522–8.

33. O’Sullivan PB, Twomey LT, Allison GT. Evaluation of specific stabilising exercises in the treatment of chronic low back pain with radiological diagnosis of spondylolisis or spondylolisthesis. Spine. 1997;22(24):2959–67.

34. Sherry MA, Best TM. A comparison of 2 rehabilitation programs in the treatment of acute hamstring strains. J Orthop Sports Phys Ther. 2004;34(3):116–25.

35. Lenth RV. Java Applets for Power and Sample Size [Computer software]. 2006–2009 [4/4/2014]. Available from: http://www.stat.uiowa.edu/~rlenth/Power.

36. Bullock-Saxton JE, Wong JE, Hogan N. The influence of age on weight-bearing joint reposition sense of the knee. Ex Brain Res. 2001;136(3):400–6.

Read More
Posted on Jul 26, 2014 in Original Article | 2 comments

‘The role of smartphones in the recording and dissemination of medical images’

Michael Kirk, MBBS1, Sarah R Hunter-Smith, BBiomed, MD2, Katrina Smith, BAppSci (Biol), Grad Dip Health Admin1, David J Hunter-Smith, MBBS, MPH, FRACS, FACS1,3

1Department of Plastic and Reconstructive Surgery, Frankston Hospital, Peninsula Health, 2 Hastings Road, Frankston 3199, Victoria, Australia; 2University of Melbourne Medical School, Parkville, Victoria, Australia; 3Monash University Plastic and Reconstructive Surgery Group, Clayton, Victoria, Australia

Correspondence Author: dhuntersmith@mac.com

Journal MTM 3:2:40–45, 2014

doi:10.7309/jmtm.3.2.7


Background: Smartphones have evolved rapidly in the medical profession, and can now produce high quality medical images, providing a quick and simple method of image distribution. This has the potential to improve clinical care of patients, but comes with specific ethical and medico-legal considerations that include issues of confidentiality, privacy and policy control.

Aim: To quantify the use, distribution and storage of medical images taken using smartphones by clinicians, along with their perceptions regarding policies, practices and patient care.

Methods: All clinicians and medical students employed or undergoing rotation at Peninsula Health during March 2012 were asked to participate in a de-identified, 36 item, online survey administered by SurveyMonkey. The survey questioned respondent’s demographics, and issues surrounding the recording and dissemination of medical images using smartphones.

Results: 134 responses were received. Most respondents were from the surgical discipline, followed by medicine, then emergency. Sixty five per cent admitted to taking medical images on their smartphones, yet no consent was obtained in almost a quarter (24%). When consent was taken, it was predominantly verbal, but only documented 23% of the time. Of those who took medical images, 64% stored them personally and 82% shared them with someone else, mostly for input from another clinician. Forty three per cent were aware that an institutional policy existed, but only 28% had read the policy.

Conclusion: Whilst the use of smartphones in a hospital setting is inevitable, the results obtained highlight issues related to privacy, confidentiality and patient care. This study will enable discussion and formulation of an evidence-based hospital policy


Introduction

Clinicians’ smartphone photography practices are an important issue, and research in this nascent area is emerging in the literature15. Technological advances have resulted in the ubiquitous presence of digital cameras in hospitals worldwide, as part of a mobile phone or in the form of a personal digital camera. Such readily available devices may lead to casual capture and accumulation of patient images, and may detract from the concept of images as elements of a patient’s medical record.

Photography assists clinicians to objectively evaluate and document medical conditions for analytical purposes, while at the same time facilitating important “before and after” comparisons. The ultimate aim of capturing, storing and sharing clinical photographs should be to improve the outcome for the individual patient. Photography is a useful adjunctive means of accomplishing this goal.

As well as being integral to medical practice, clinical photography is also essential to our role as mentors and teachers. Whether teaching young colleagues at the bedside or via peer reviewed journal publications and clinical presentations, photography plays an important role in illustrating particularly interesting and rare cases to the wider medical community.

Technology advances at an ever-increasing rate within the health sector, bringing with it a range of ethical and legal dilemmas6. The ownership of medical images taken in this environment is one such dilemma and is different to those of other documents because of the sensitive nature and duty of confidentiality assumed by the patient when the image is taken. Taking an image does not necessarily mean ownership of the image, for instance in the public sector these photographs may become both the property and responsibility of the hospital8.

When clinical photographs are taken, patients are often vulnerable and undignified; our performance as clinicians must be transparent, honest, legal and auditable at all times6, 7. Doctors have always had an obligation to maintain confidentiality in relation to patient information. A breach of privacy or confidentiality can lead to a complaint of professional misconduct, and potential disciplinary proceedings before medical boards and authorities8. In addition, clinical decision-making is influenced by the information contained within the image, making the image an important part of the patient clinical record. The image should be stored in the medical record, be archived and available to the patient through ‘freedom of information’ legislation.

A medical practitioner can only use or disclose health information for the purpose for which it was collected, unless the individual’s consent has been obtained – and not doing so may have serious consequences9. Patients also have the right to withdraw their consent at anytime in the future.

The loss or misplacement of a portable device containing unsecured medical images present privacy risks to individuals and organisations. Recent healthcare legislative changes to the Australian privacy act took effect in March 2014. Under these changes to federal law, health professionals with unsecured patient images on their smart devices will face fines up to $340,000 and institutions up to $1,700,000 for a breach of patient privacy9. Australian regulations stipulate that sensitive data, such as information that constitutes part of the medical record, cannot be transferred across Australian borders. This issue of trans-border security and data flow has not, until recent times, been addressed by suitable large-scale data storage facilities within Australia (for example, Amazon web services10 offer storage that can only be accessible within particular countries). Whether commercial operations will satisfy Australian privacy standards is yet to be tested.

The core policies and principles of using smartphones are no different to using a film camera or stand-alone digital camera. Most health care organisations (including ours) have policies that address the safe collection of such images. However these policies now need to address electronic issues such as evidence of signed informed consent, delineation of specific intended use(s), strong encryption of transmitted data with authenticated access, and secure storage thereof11.

Smartphones have evolved to the point that they now routinely integrate a digital camera of an acceptable clinical quality capable of capturing medical images. Multimedia messaging (MMS), email services, and social networking provides a quick and simple method of media distribution. This rapid evolution of technology creates the potential to enhance the clinical care of patients within a hospital environment, but also brings with it issues of confidentiality, privacy and policy control2, 46, 12. Their uptake by physicians in a clinical setting has evolved at a rapid rate over the past decade13 to the point that most clinicians now carry a camera embedded device in their pocket when undertaking clinical work. However, the prevalence of one of the simplest operations available on these devices, namely the photographic function, has been poorly described or quantified.

The aim of this study is to quantify the use, storage and dissemination of medical images taken on smartphones in a clinical environment, and to assess perceptions regarding policies, practice and patient care.

Methods

All clinicians and medical students employed or undergoing rotation at an outer metropolitan hospital in Melbourne, Australia during March 2012 (n= 409) were sent an email inviting them to participate in a de-identified 34 item online survey administered by SurveyMonkey(™)14. The survey (Figure 2) was piloted on a number of medical staff whose results were not included in the final analysis. The survey questioned respondent’s demographics and medical speciality as well as issues surrounding the recording and dissemination of medical images using smartphones. Two email reminders were sent over a one-month period. The HREC committee of Peninsula Health reviewed the research methodology. Because of the sensitivity of the nature of this study, full committee ethical approval was required and approval granted for this study (Peninsula Health HREC/12/PH/26).

Results

Demographics (Table 1)

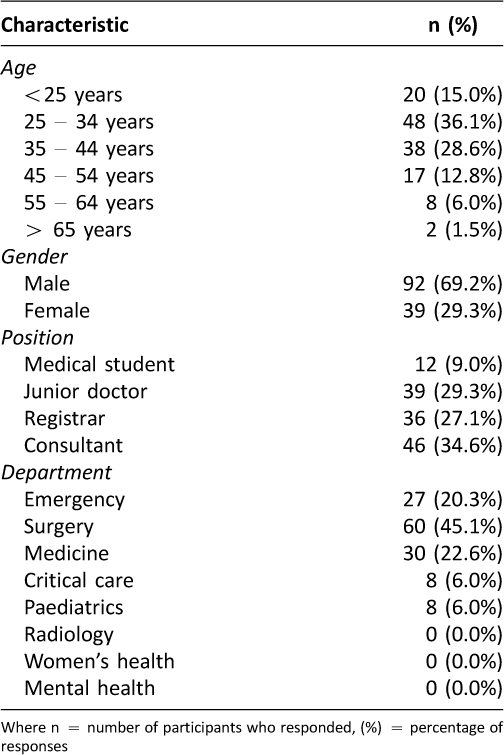
134 responses (32%) were received. The majority of the respondents were from the surgical discipline (45%), followed by medicine (22%), emergency medicine (20%), critical care (7%) and paediatrics (6%). Consultants were the highest respondents (35%), followed by registrars (27%). No responses were received from women’s health, mental health or radiology.

Table 1: Participant characteristics

Smartphone ownership (Figure 1)

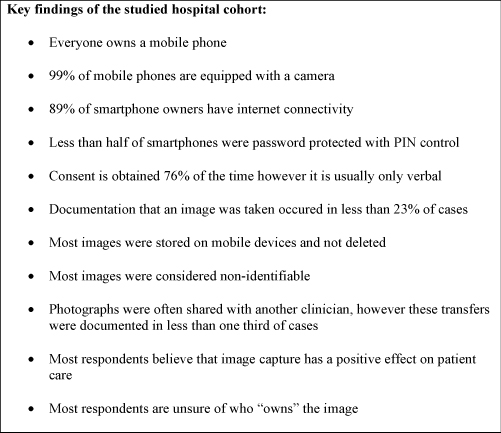
All but one respondent (99%) owned a mobile phone equipped with a camera, with 89% of smartphone owners having Internet connectivity. Less than half of smartphones were password protected with PIN control.

Figure 1: Key points: Smartphone ownership and characteristics

Image-capture, distribution & consent (Figure 1)

Almost two-thirds (65%) of respondents acknowledged taking medically sensitive images on a personal device, yet in nearly a quarter of cases (24%) no consent at all was gathered. For those that did obtain consent, only 7% gained written consent, whilst 78% failed to document the procedure in the patient record. Images were kept by 63% of clinicians, either on the device itself (64%), on another storage device (12%) or on both the device and another storage device (21%). Four per cent of clinicians stored their images both locally and on Internet “cloud” based storage.

Figure 2: SMARTPHONE QUESTIONNAIRE Questions asked of participants (all response options not shown):

The most common method used to share an image was physically on the device itself, with non-secure delivery techniques including multimedia-messaging service (MMS), email, and instant messaging prevalent. One respondent admitted to uploading these medical images to a social networking site (Facebook or Twitter).

Perceptions, policies & protocols

Only 43% of respondents were aware that an institutional policy existed regarding medical image photography, and of those respondents, only 28% recalled reading such a policy. Perceptions regarding ownership of captured medical images varied, however less than half of the respondents accurately understood that the employer owned the image i.e. the hospital. Most thought (incorrectly) that the patient was the owner of the image.

Respondents often stated multiple reasons for image capture which included ‘input from another clinician’, ‘education or training purposes’, ‘usage in presentations’, to ‘show someone outside the hospital’ or simply due to the fact they found something interesting or unusual about the case. The vast majority (90%) of clinicians felt the use of clinical photography using smartphone technology had a positive effect on patient care.

Discussion

Medical photography is widely accepted as an important part of contemporary medical practice with benefits that are well recognised15. Technology now has evolved to a point where personal devices have the ability to not only capture these images, but also easily store and distribute them. Ultimately their primary function in a professional environment is to deliver quality clinical care to patients in a timely and resource friendly manner. Our collective aim should be to bridge the divide between legislation, local policy and best practice.

This report highlights the growing use of personal devices within the clinical environment to assist with the delivery of quality patient care in an increasingly globalised healthcare system. This study supports the notion that although clinical photography is commonly used in clinical practice1618, there is a general lack of understanding regarding policy, image ownership, professional obligation and risks associated with the use of smartphone technology.

The results of this study seem compelling (Figure 1), however, because of the small sample size and single institutional basis it is important not to generalize these findings to the wider health care community. Further multicentre studies will help to establish whether these obvious and important findings are consistent across a larger sample size.

There has been much debate regarding the ethics and legality of taking clinical photographs using personal cameras, whether these be part of a mobile telephone or the user’s own digital camera46, 1821. In practice, it appears that these considerations impact little on clinicians, who most commonly use a personal digital camera5.

A clinical photograph may be, and is likely to be considered part of a patient’s medical record, even when stored electronically. Doctors should be aware of the applicable health records legislation within the state in which they practice, as they may be obligated to hold patient records — in most cases, for seven years6. In addition, patients may be able to access their own clinical photographs in the context of freedom of information legislation.

This paper highlights privacy issues, poor recognition of hospital policy, lack of consent or documentation, and an overall ignorance to legislative and hospital guidelines. Although this study did not explore patient perceptions, there is evidence to confirm most patients are happy for images to be taken by treating clinicians but unhappy for clinicians involved directly in their care to store their clinical images stored on personal devices22.

Conclusion

We now find ourselves on the brink of new Australian legislative requirements23 that will force healthcare professionals to change what are already entrenched practices. Medical practitioners and their employers should appreciate that this area of law is a dynamic one and aim to stay abreast of changes in legislation when drafting their own policies and practices6.

Users of smartphone cameras for clinical purposes require education into their responsibility regarding patient privacy and photography. The core policies and principles are no different to using a film camera or stand-alone digital camera and in many organisations almost certainly already exist. The major difference using a smartphone camera is the ease of making a clinical photograph publicly available, which presents more of an education issue than a policy issue.

The issues that need to be addressed include;

  • The poor understanding of hospital policy,
  • The apparent lack of knowledge about legislative requirements (consent, medical record statutes, freedom of information laws, trans-border data flow and image ownership), and
  • Creation of hospital workflows that allow the use of new technology such as smartphones in a safe and compliant manner.

Our organisation has begun processes to develop new procedural policy and education that will ensure the safe capturing of medical images a standard practice.

Acknowledgements

None.

Funding/Support

Nil

Ethical approval

The Research and Ethics committee of the Peninsula Health care network Australia approved this study.

Disclosures

David Hunter-Smith holds shares in the smartphone application company Picsafe Medi Pty Ltd.

References

1. Lewis N. Healthcare mobile devices forcast to gain 7%. Information Week [Internet]. 2010, Feb 7. Available from: http://www.informationweek.com/mobile/healthcare-mobile-devices-forecast-to-gain-7-/d/d-id/1090464?

2. Fernando J. Clinical software on personal mobile devices needs regulation. Med J Aust. 2012;196(7):437.

3. Dolan PL. Physician smartphone popularity shifts health IT focus to mobile use. American Medical News [Internet]. 2010 Aug 23. Available from: http://www.amednews.com/article/20100823/business/308239976/1/

4. Burns K, Belton S. “Click first, care second” photography. Med J Aust. 2012;197(5):265.

5. Berle I. Clinical photography and patients rights: the need for orthopraxy. J Med Ethics. 2008;34(2):89–92.

6. Mahar PD, Foley PA, Sheed-Finck A, Baker CS. Legal considerations of consent and privacy in the context of clinical photography in Australian medical practice. Med J Aust. 2013;198(1):48–9.

7. Australian Medical Council. Good medical practice: A code conduct for doctors in Australia. Canberra: Australian Medical Council, July 2009.

8. Gorton M, Tobin I. Making complaints against health practitioners – are you protected? Russell Kennedy Client Bulletin. 2012.

9. Privacy Amendment (Enhancing Privacy Protection) Act 2012, S1 – Australian Privacy Principles.

10. What’s new: Amazon CloudFront adds GeoRestriction feature: Amazon Web Services, Inc.; 2014. Available from: http://aws.amazon.com/about-aws/whats-new/2013/12/18/amazon-cloudfront-adds-geo-restriction-feature/.

11. McDonald K. Cloud-based solution for mobile clinical photography. Pulse IT. 2012:42–3.

12. Chretien KC, Greysen SR, Chretien JP, Kind T. Online posting of unprofessional content by medical students. JAMA. 2009;302(12):1309–15.

13. Franko OI, Tirrell TF. Smartphone app use among medical providers in ACGME training programs. J Med Syst. 2012;36(5):3135–9.

14. SurveyMonkey. Palo Alto, California, USA. Available from: http://www.surveymonkey.com.

15. Cleland H, Ross R, Kirk M, Hunter-Smith DJ. Clinical photography: Surgeons need to get smart. ANZ J of Surg. 2013;83:600–1.

16. Farshidi D, Craft N, Ochoa MT. Mobile teledermatology: as doctors and patients are increasingly mobile, technology keeps us connected. Skinmed. 2011;9(4):231–8.

17. Piek J, Hebecker R, Schuteze M, Sola S, Mann S, Buchholz K. Image transfer by mobile phones in neurosurgery. Zentralbl Neurochir. 2006;67(4):193–6.

18. Burns K, Belton S. Clinicians and their cameras: policy, ethics and practice in an Australian tertiary hospital. Aust Health Rev. 2013;37(4):437–41.

19. Harty-Golder B. Photos and “photo cell phones” prompt new policies. MLO Med Lab Obs. 2004;36(3):40.

20. Seigmund CJ, Niamat J, Avery CM. Photographic documentation with a mobile phone camera. Br J Oral Maxillofac Surg. 2008;46(2):109.

21. Derbyshire SW, Burgess A. Use of mobile phones in hospitals. BMJ. 2006;333(7572):767–8.

22. Qureshi A, JC K. Patient knowledge and attitidue towards information technology and teledermatology: some tentative findings. Telemed J E Health. 2003;9(3):259–64.

23. Earles M. New reform to Australia’s privacy laws. Vicdoc. Feb 2013:14–5.

Read More

Posted on Jul 26, 2014 in Original Article | 0 comments

mHealth intervention development to support patients with active tuberculosis


Sarah J. Iribarren, PhD1,2, Susan L. Beck, PhD, APRN, FAAN, AOCN2, Patricia F. Pearce, MPH, PhD, APRN, FAANP, FANP3, Cristina Chirico, MPH, MD4, Mirta Etchevarria4, Fernando Rubinstein, MPH, MD5

1Columbia University School of Nursing, New York, NY, USA; 2University of Utah, College of Nursing, Salt Lake City, UT, USA;

3School of Nursing, Loyola University, New Orleans, LA, USA; 4Region V TB Program, Province of Buenos Aires, Argentina;

5Institute for Clinical Effectiveness and Healthcare Policy, Buenos Aires, Argentina

Corresponding author: si2277@cumc.columbia.edu

Journal MTM 3:2:16–27, 2014

doi:10.7309/jmtm.3.2.4


Background: Mobile Health (mHealth) based interventions have been increasingly used to improve a broad range of health outcomes. However, few researchers have reported on the process or the application of theory to guide the development of mHealth based interventions, or specifically for tuberculosis (TB) treatment management.

Aims: To describe the steps, process, and considerations in developing a text messaging-based intervention to promote treatment adherence and provide support to patients with active TB.

Methods: Traditional qualitative techniques, including semi-structured interviews, field notes, content analysis, iterative coding, and thematic analysis, were used to design and document the intervention development with a multidisciplinary team of researchers, clinicians, administrators, and patients who were in active TB treatment. The Information-Motivation-Behavioral Skills (IMB) model was used to guide the coding scheme for content analysis of patient-directed TB educational material and intervention development.

Results: The development steps included: a) establishing intervention components, including justifications, considerations, timing and frequency of components; b) developing educational messages, including cultural adaption, text or short message service (SMS) formatting, and prioritizing message delivery order; and c) determining implementation protocol. A set of 16 IMB-based messages were developed for the educational component. Final intervention development was achieved in 3 months.

Conclusion: A collaborative approach and application of a theory to guide the intervention design and development is supported. Although a collaborative approach was more time consuming, it resulted in a more responsive, culturally appropriate, and comprehensive intervention. Considerations for developing a text messaging based intervention are provided and may serve as a guide for similar interventions. Further empirical evidence is needed for applying the IMB model for adherence-promotion in TB efforts.


Read More