Principles of m-Health survey design
..
Dr Rahul Chakrabarti MBBS1,2
1 Editor-In-Chief, Journal of Mobile Technology in Medicine, 2Centre for Eye Research Australia
Corresponding Author: rahul@journalmtm.com
Journal MTM 1:3:1-5, 2012
doi:10.7309/jmtm.16
Before you start
The first step is to conduct a critical appraisal of existing literature relevant to the research question. Before proceeding further, it is then necessary to consider whether a survey is the most appropriate method to collect the data required to answer the research question. Appropriate alternatives to surveys include a systematic review or meta-analysis, case-studies, or studies with focus groups. It is beyond the scope of this article to discuss these alternate forms in depth, however, the researcher should be guided by published literature in their topic. The key steps for survey design will now be discussed. (Refer to figure 1).
Step 1. Define research objectives
Step 2. Sampling frame and sample selection
Step 3. The sample size
Step 4 . Mode of data collection
Step 5. Construct and Pre-test questionnaire
Step 6. Recruit and measure sample
Step 7. Preparing data for statistical analysis
Step 8. Analysis of data
Step 9. Writing the report
Figure 1 – Summary of Critical Steps for Survey Design
Step 1. Define the Research Objectives
The literature review should formulate a set of clear research objectives. These objectives should incorporate the outcome(s) of interest and the target population. Franko et al offer an excellent example in their review of iPad applications for orthopaedic surgeons where the objectives are neatly summarised in the statement, ‘the purpose of this study was to collect, analyse, and summarise orthopaedic-related iPad apps for students, patients, and medical providers’.1Franko OI, Bhola S. iPad apps for orthopedic surgeons. Orthopedics. 2011 Dec;34(12):978-81. The study design was clearly defined as a review of all applications accessible on iTunes, and the target population was stipulated early in the paper. In the methods section the authors expanded upon the research objectives by defining variables of interest and data analysis techniques.
Step 2. Sampling frame and sample selection
Selecting an appropriate sample of respondents is a critical step in planning the results because sampling bias influences the degree to which results and conclusions are applicable to a population outside of the study. The ‘sampling frame’ refers to a list of population members. From here, several sample selection methods can be applied. Drolet et al provided an excellent example of surveying from the sampling frame in their assessment of working hours of resident medical officers in North America.2Drolet BC, Christopher DA, Fischer SA. Residents' response to duty-hour regulations--a follow-up national survey. N Engl J Med. 2012 Jun 14;366(24):e35. The authors derived a complete list of directors in training of all 682 medical institutions in North America, from which 123 institutions across 41 states agreed to participate. Whilst this type of sampling is ‘ideal’, it is resource intensive, and can be limited by non-participation.
Sampling can be broadly conceptualised as a ‘probability’ or ‘non-probability’ model. Probability sampling methods allow each member of the population to have a chance (probability not equal to zero) of being selected in the sample. This allows assessment and control of potential sampling error. Comparatively, examples of non-probability sampling include those of convenience, personal judgement, or a quota. Therefore, it is recommended, where possible to use probability sampling to assist in knowing and controlling for sampling error. (Refer to Table 1).
| Sampling Method | Description | Example |
| Simple random sampling | A simple random sample is a basic probability method of sampling. The example includes a random-number generator to select participants. Whilst it is simple, it can be costly, particularly if the population is large, and there remains a probability that the sample does not adequately represent the target population of interest to meet the objectives. | Blumberg et al, 20063Blumberg SJ, Luke JV, Cynamon ML. Telephone coverage and health survey estimates: evaluating the need for concern about wireless substitution. Am J Public Health. 2006 May;96(5):926-31.Study: Telephone coverage and health survey estimatesDesign: Simple random sample of all residential telephone numbers from the national registry of landline telephone numbers. |
| Systematic sample | In systematic sampling, every nth participant from a population is included in the sample. This form of sampling may be used when the population size is unknown, but can produce bias if the population parameter of interest is known to occur in certain clusters. | Rose et al, 20064Rose AM, Grais RF, Coulombier D, Ritter H. A comparison of cluster and systematic sampling methods for measuring crude mortality. Bull World Health Organ. 2006 Apr;84(4):290-6.Study: Comparison of cluster and systematic sampling methods for measuring crude mortality.Design: Systematic sample of one in three compounds of households were surveyed from a particular district, and one household from each compound was randomly selected. |
| Stratified sample | In this technique, the population is stratified into mutually exclusive subsets (for example, gender, age, occupation) and then simple random sampling is applied to each strata identify participants. Stratified sampling can produce very accurate results; however, one must ensure adequate sample size is selected from within strata. | Wallihan et al, 19995Wallihan DB, Stump TE, Callahan CM. Accuracy of self-reported health services use and patterns of care among urban older adults. Med Care. 1999 Jul;37(7):662-70.Study: Accuracy of self-reported health services uses and patterns of care amongst urban older adults.Design: Stratification based on ethnic background in North America. |
| Cluster sample | As the name implies, cluster sampling involves division of the population into clusters that may not necessarily be mutually exclusive. A random sample of these clusters is then selected, and all members of the selected clusters are then included in the survey. Cluster sampling is often used when the sample frame is unknown. This method can produce very accurate results, but is heavily dependent on careful, un-biased clustering of the population. | Curtis et al, 20016Curtis V, Kanki B, Cousens S, Diallo I, Kpozehouen A, Sangare M, et al. Evidence of behaviour change following a hygiene promotion programme in Burkina Faso. Bull World Health Organ. 2001;79(6):518-27.Study: Evidence of behaviour change following hygiene promotion programme in Burkina Faso.Design: Households in a particular city were divided into location clusters (for example, inner, central, outer zones). |
Table 1 – Comparison of probability based sampling methods.
Step 3. The sample size
Sample size determination is important to achieve desirable accuracy and confidence of the results with minimum waste of resources. Whilst the statistical mathematics can become intricate, the key principles to consider for calculating sample size are: to assess what is the required level of precision, variability within the target population, resource constraints (cost, time etc.), and the selected sampling methodology.7Gogtay N. Principles of sample size calculation. Indian J Ophthalmol. 2010;58(6):517-8. Simplistically, for most qualitative research, larger sample sizes are better.
But how much is enough? Often a simple activity is to conduct a preliminary survey, from which observed results can guide the final sample size estimate. In principle, the sample size should aim to achieve minimum standard error (standard deviation of a particular sample relative to other samples in a population).
The estimation of sample size is often an important opportunity to involve statistical consultation early in the research planning phase. This will enable researchers need to consider what data collection and analytical methods are most appropriate to address the domains of the research question.
Step 4. Mode of data collection
The commonly used methods for survey data collection include internet-based, postal mail questionnaires, face-face interviews, telephone or a combination of these techniques.8Owens L. Introduction to survey research design. Accessed at: http://www.srl.uic.edu: University of Illinois2005. The emerging popularity of internet-based surveys has been attributed to their lower cost, ease of data collection, ability to program complex skip patterns within the survey, and ease of distributing to international participants. However, as Perera highlighted, there is a need to ensure that survey data is confidential, secure and adheres to research ethics conduct.9Perera C. Principles of security for the use of mobile technology in medicine. Journal of Mobile Technology in Medicine. 2012;1(2):5-7. Comparison of data collection methods are shown in Table 2.
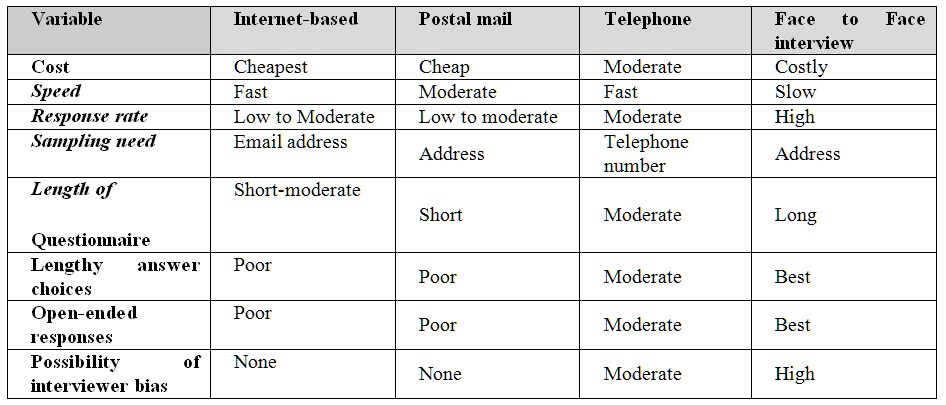
Table 2 – Comparison of survey methods for data collection.
Step 5. Construct and Pre-test questionnaire
Question selection
Developing the items to be included in a questionnaire should be guided by the objectives of the study, and previous literature. Qualitative methods such as focus groups, key informant interviews and Delphi method can also be used to identify key themes that need to be addressed.10Iljaz RJ, Meglic M, Svab I. Building consensus about eHealth in Slovene primary health care: Delphi study. BMC Med Inform Decis Mak. 2011;11:25.,11Morgan D. Focus groups. Ann Rev Sociol. 1996;22:129-52. The items to be surveyed are dependent on the research question, and will cover a broad range of information categories including knowledge, opinions, behaviour and attributes.
Question synthesis
In preparing the questionnaire, the framing and wording of questions must also be tailored to the objectives. Questions or survey items can be asked in an open and closed-ended manner. Open-ended questions are useful in generating ideas and for exploratory research. However, the major disadvantage is the variability of answers and the need for ‘coding’ of answers prior to qualitative analysis. Comparatively, closed-ended questions are designed with a set of pre-determined answers, which can be easily tabulated and analysed. However, authors must be vigilant of catering for an appropriate range of answers, and relevance of the questions. Responses to closed-ended questions are typically based on a scale of options that can be nominal (e.g. a list of tablet devices), ordinal (e.g. year of postgraduate experience), continuous (e.g. visual analogue pain score), or Likert scale (e.g. levels of agreement with a statement from strongly disagree to strongly agree). Given that majority of surveys use an ordinal or Likert scaling system, it is useful to avoid having responses that are neutral, or at extreme ends of a scale (such as ‘never’ or ‘always’).
Some surveys can also incorporate a series of ‘Filter’ questions. For example, ‘Do you own a tablet device? If Yes, which one. If No, proceed to next question’. These are more easily integrated in an electronic survey that can program specific skip patterns. Fundamentally, wording of the question needs to be clear, succinct, and should avoid ambiguous terms and double-negative statements.
The pre-testing of the survey should follow the development of the survey itself. This phase involves distribution of the survey to people resembling the target sample and receiving critical appraisal of the practical limitations, including survey length, content, instructions, appropriateness and order of questions. After incorporating the comments from pre-testing, the survey is then ready for distribution.
Step 6. Recruit and measure sample
Fundamentally, recruitment of a sample for the survey must endeavour to eliminate the influence of bias. As aforementioned, where possible a probability method of sampling is most desirable, and further stratification may reduce sampling error. It is pertinent to recall that using a large sample does not necessarily reduce sampling bias. However, researchers should plan ahead for non-response or attrition bias by improving the questionnaire, training of people to deliver surveys (if face-face methods are used), and informing members of the sample prior to sending the survey.
Step 7. Preparing data for statistical analysis
The critical phase of analysis begins with preparation of the data. Qualitative methods require ‘coding’ of the data by assigning numerical values to responses, and formulating frequency tables. At this stage it is also important where relevant, to perform descriptive statistics to identify outliers.
Step 8. Analysis of data
The analysis of data depends on the survey design.12Arsham H. Questionnaire design and surveys sampling. Accessed at: home.ubalt.edu/ntsbarsh/stat-data/surveys.htm. Baltimore: University of Baltimore; Available from: home.ubalt.edu/ntsbarsh/stat-data/surveys.htm. Basic descriptive statistics are often a useful way to start and can be performed using a variety of commercial statistical software, for example Stata © StataCorp LP, SPSS © IBM, or Microsoft © Excel.
Averages and variability
Describing average and variability depends on the type of data collected. For ordinal data or highly skewed data it is preferable to use the median. If the median has been selected, an appropriate measure of variability is the inter-quartile range (the range in which the 25th centile and 75th centile of responses exist). Comparatively, for data that obeys a normal distribution, the mean and standard deviation should be used.
Relationships
There are a plethora of tests that can be used to describe relationships between non-numerical variables. For example, a contingency table can be used to compare the relationship between two nominal variables. If there are unequal respondents between the groups then percentages can be used in the contingency table. In the case of describing a relationship between variables with equal intervals a correlation coefficient can be calculated. It is beyond the scope of this article to describe in depth statistical methods, however, often the simplest statistical methods are the most effective in communicating the result to be inferred.
Margin of Error
Where possible, analysis should endeavour to calculate the effects of bias in a sample. A simple method is to calculate the standard error of the sample estimate. This can be reflected in the standard error of a mean, median or a percentage. When comparing two or more groups a confidence interval should be derived to measure the precision of the result.
Step 9. Writing the report
The synthesis of results, analysis and discussion follow the standard outline of a scientific publication. It is most important at this final stage to address the objectives and communicate the results in the simplest manner possible. Importantly, the discussion section should comment on limitations of the methodology. This should address sample size, limitations of the survey technique, non-response bias, and importantly provide guidance for the direction of future studies.
Conclusion
This editorial has endeavoured to cover the principles of designing and implementing a successful survey. There is no ‘gold-standard’ for what items or questions should be included in a survey related to m-Health. This is dependent on the independent objectives of the research. However, further guidance can be obtained from several excellent examples in this field. Readers are encouraged to read ‘Electronic health records in ambulatory care’ by DesRoches et al13DesRoches CM, Campbell EG, Rao SR, Donelan K, Ferris TG, Jha A, et al. Electronic health records in ambulatory care--a national survey of physicians. N Engl J Med. 2008 Jul 3;359(1):50-60., ‘New horizons for health through mobile technologies’ a World Health Organisation report14WHO. mHealth, New horizons for health through mobile technologies: Based on the findings of the second global survey on eHealth. Geneva: WHO2011., and ‘Smartphone App use among medical providers in ACGME training programs’.15Franko OI, Tirrell TF. Smartphone App Use Among Medical Providers in ACGME Training Programs. J Med Syst. 2011 Nov 4. Hopefully this will stimulate ideas and facilitate high-quality surveys related to mobile technologies in medical practice.
References
1. Franko OI, Bhola S. iPad apps for orthopedic surgeons. Orthopedics. 2011 Dec;34(12):978-81. ![]()
2. Drolet BC, Christopher DA, Fischer SA. Residents’ response to duty-hour regulations–a follow-up national survey. N Engl J Med. 2012 Jun 14;366(24):e35. ![]()
3. Blumberg SJ, Luke JV, Cynamon ML. Telephone coverage and health survey estimates: evaluating the need for concern about wireless substitution. Am J Public Health. 2006 May;96(5):926-31. ![]()
4. Rose AM, Grais RF, Coulombier D, Ritter H. A comparison of cluster and systematic sampling methods for measuring crude mortality. Bull World Health Organ. 2006 Apr;84(4):290-6. ![]()
5. Wallihan DB, Stump TE, Callahan CM. Accuracy of self-reported health services use and patterns of care among urban older adults. Med Care. 1999 Jul;37(7):662-70. ![]()
6. Curtis V, Kanki B, Cousens S, Diallo I, Kpozehouen A, Sangare M, et al. Evidence of behaviour change following a hygiene promotion programme in Burkina Faso. Bull World Health Organ. 2001;79(6):518-27.
7. Gogtay N. Principles of sample size calculation. Indian J Ophthalmol. 2010;58(6):517-8. ![]()
8. Owens L. Introduction to survey research design. Accessed at: http://www.srl.uic.edu: University of Illinois2005.
9. Perera C. Principles of security for the use of mobile technology in medicine. Journal of Mobile Technology in Medicine. 2012;1(2):5-7. ![]()
10. Iljaz RJ, Meglic M, Svab I. Building consensus about eHealth in Slovene primary health care: Delphi study. BMC Med Inform Decis Mak. 2011;11:25. ![]()
11. Morgan D. Focus groups. Ann Rev Sociol. 1996;22:129-52. ![]()
12. Arsham H. Questionnaire design and surveys sampling. Accessed at: home.ubalt.edu/ntsbarsh/stat-data/surveys.htm. Baltimore: University of Baltimore; 2011 [cited 2012 2/5/2012]; Available from: home.ubalt.edu/ntsbarsh/stat-data/surveys.htm.
13. DesRoches CM, Campbell EG, Rao SR, Donelan K, Ferris TG, Jha A, et al. Electronic health records in ambulatory care–a national survey of physicians. N Engl J Med. 2008 Jul 3;359(1):50-60. ![]()
14. WHO. mHealth, New horizons for health through mobile technologies: Based on the findings of the second global survey on eHealth. Geneva: WHO2011.
15. Franko OI, Tirrell TF. Smartphone App Use Among Medical Providers in ACGME Training Programs. J Med Syst. 2011 Nov 4.
